XP Inc Results Presentation Deck
Non-GAAP Financial Information
Floating and Adjusted Gross Financial Assets
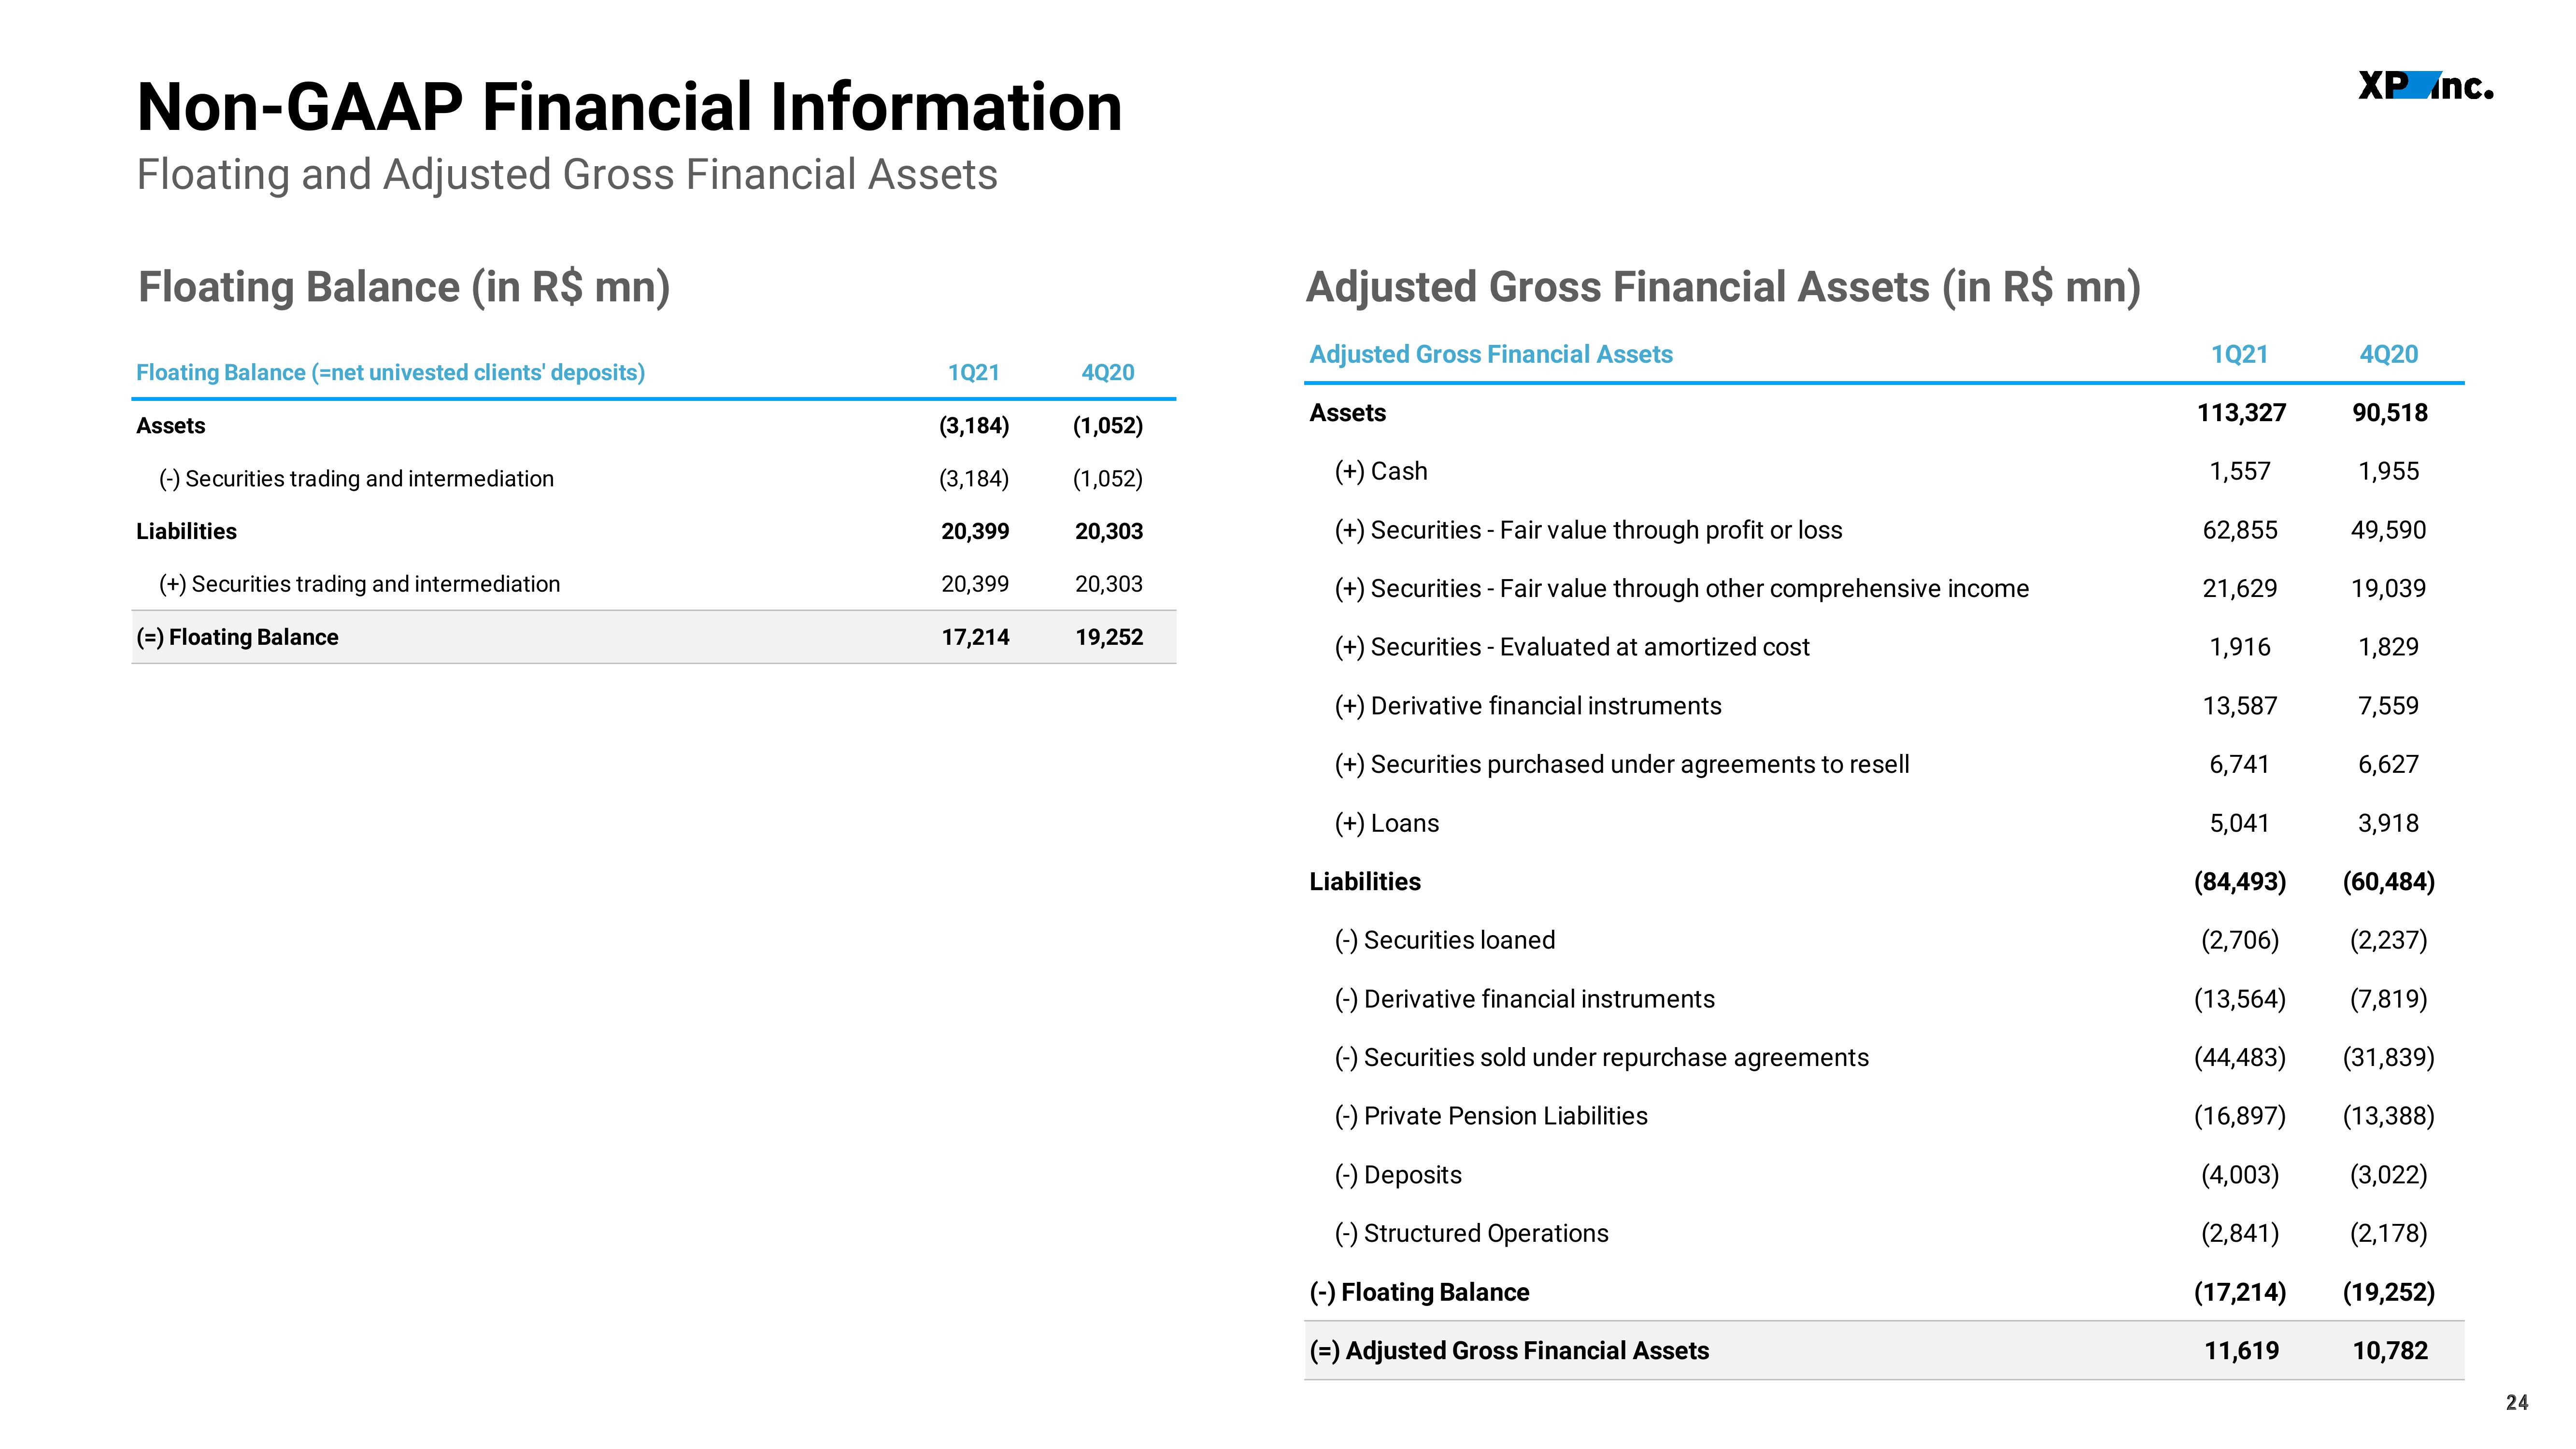
Floating Balance (in R$ mn)
Floating Balance (=net univested clients' deposits)
Assets
(-) Securities trading and intermediation
Liabilities
(+) Securities trading and intermediation
(=) Floating Balance
1Q21
(3,184)
(3,184)
20,399
20,399
17,214
4Q20
(1,052)
(1,052)
20,303
20,303
19,252
Adjusted Gross Financial Assets (in R$ mn)
Adjusted Gross Financial Assets
Assets
(+) Cash
(+) Securities - Fair value through profit or loss
(+) Securities - Fair value through other comprehensive income
(+) Securities - Evaluated at amortized cost
(+) Derivative financial instruments
(+) Securities purchased under agreements to resell
(+) Loans
Liabilities
(-) Securities loaned
(-) Derivative financial instruments
(-) Securities sold under repurchase agreements
(-) Private Pension Liabilities
(-) Deposits
(-) Structured Operations
(-) Floating Balance
(=) Adjusted Gross Financial Assets
1Q21
113,327
1,557
62,855
21,629
1,916
13,587
6,741
XP nc.
4Q20
90,518
1,955
49,590
19,039
1,829
7,559
6,627
3,918
5,041
(84,493)
(60,484)
(2,706)
(2,237)
(13,564)
(7,819)
(44,483)
(31,839)
(16,897)
(13,388)
(4,003)
(3,022)
(2,841)
(2,178)
(17,214) (19,252)
11,619
10,782
24View entire presentation