Credit Suisse Investment Banking Pitch Book
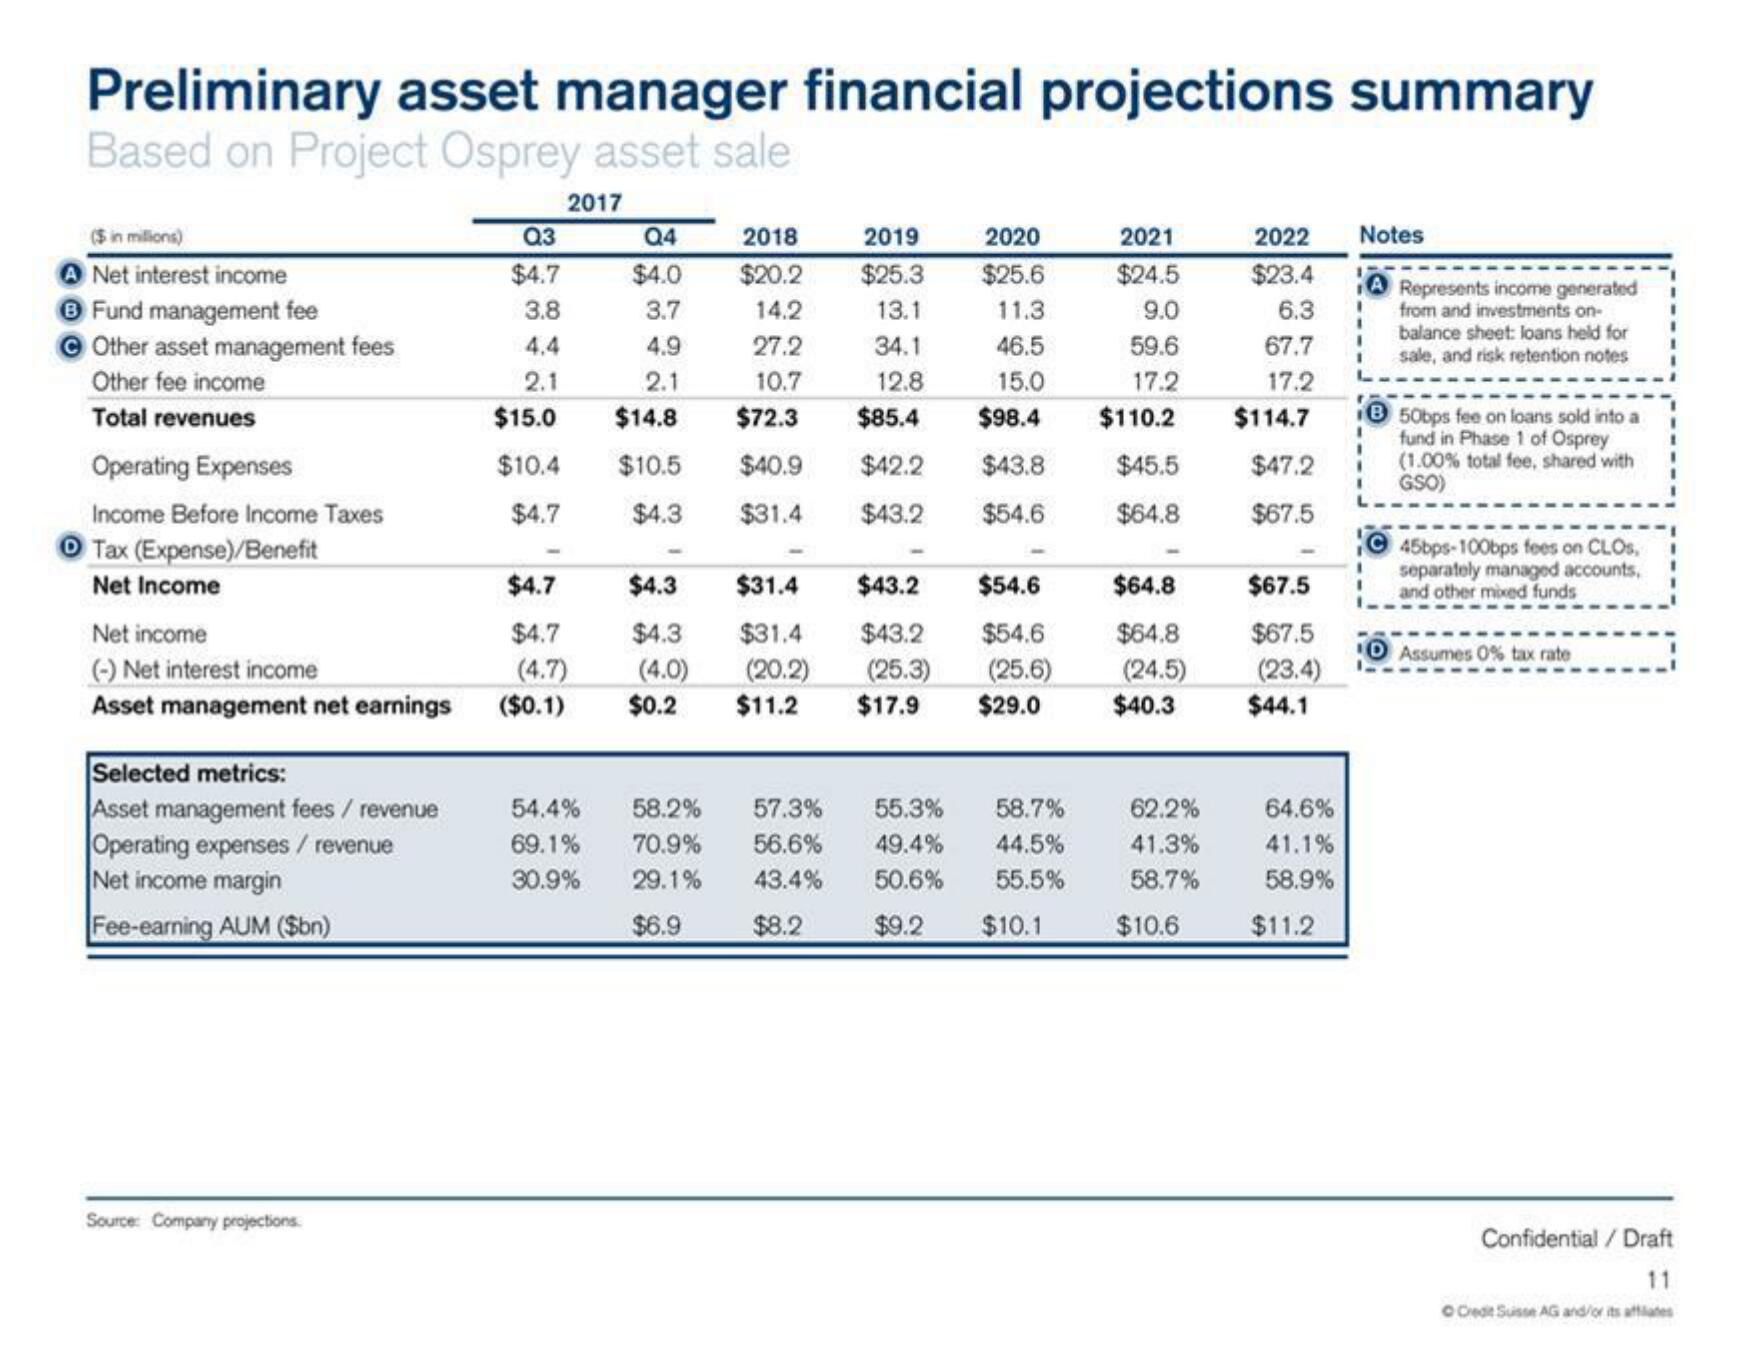
Preliminary asset manager financial projections summary
Based on Project Osprey asset sale
($ in millions)
Net interest income
6 Fund management fee
Other asset management fees
Other fee income
Total revenues
Operating Expenses
Income Before Income Taxes
Ⓒ Tax (Expense)/Benefit
Net Income
Net income
(-) Net interest income
Asset management net earnings
Selected metrics:
Asset management fees / revenue
Operating expenses / revenue
Net income margin
Fee-earning AUM ($bn)
Source: Company projections
Q3
$4.7
3.8
4.4
2.1
$15.0
$10.4
$4.7
2017
$4.7
$4.7
(4.7)
($0.1)
Q4
2018
2019
2020
2021
$4.0 $20.2 $25.3 $25.6
$24.5
3.7
14.2
13.1
11.3
9.0
4.9
34.1
46.5
59.6
2.1
12.8
15.0
17.2
$14.8
$85.4
$98.4 $110.2
$10.5
$42.2
$43.8
$45.5
$4.3
$43.2
$54.6
$64.8
-
27.2
10.7
$72.3
$40.9
$31.4
$4.3
$31.4
$43.2 $54.6
$4.3
$31.4
$43.2
$54.6
(4.0) (20.2) (25.3)
(25.6)
$0.2 $11.2 $17.9 $29.0
54.4% 58.2% 57.3% 55.3% 58.7%
69.1% 70.9% 56.6% 49.4% 44.5%
30.9% 29.1% 43.4%
50.6% 55.5%
$6.9
$8.2
$9.2 $10.1
$64.8
$64.8
(24.5)
$40.3
62.2%
41.3%
58.7%
$10.6
2022
$23.4
6.3
67.7
17.2
$114.7
$47.2
$67.5
$67.5
(23.4)
I
$67.5 I
$44.1
64.6%
41.1%
58.9%
Notes
A Represents income generated
from and investments on-
balance sheet: loans held for
sale, and risk retention notes
$11.2
1
B 50bps fee on loans sold into a
fund in Phase 1 of Osprey
(1.00% total fee, shared with
GSO)
45bps-100bps fees on CLOS,
separately managed accounts,
and other mixed funds
10 Assumes 0 % tax rate
Confidential / Draft
11
O Credit Suisse AG and/or its affiliatesView entire presentation