Baird Investment Banking Pitch Book
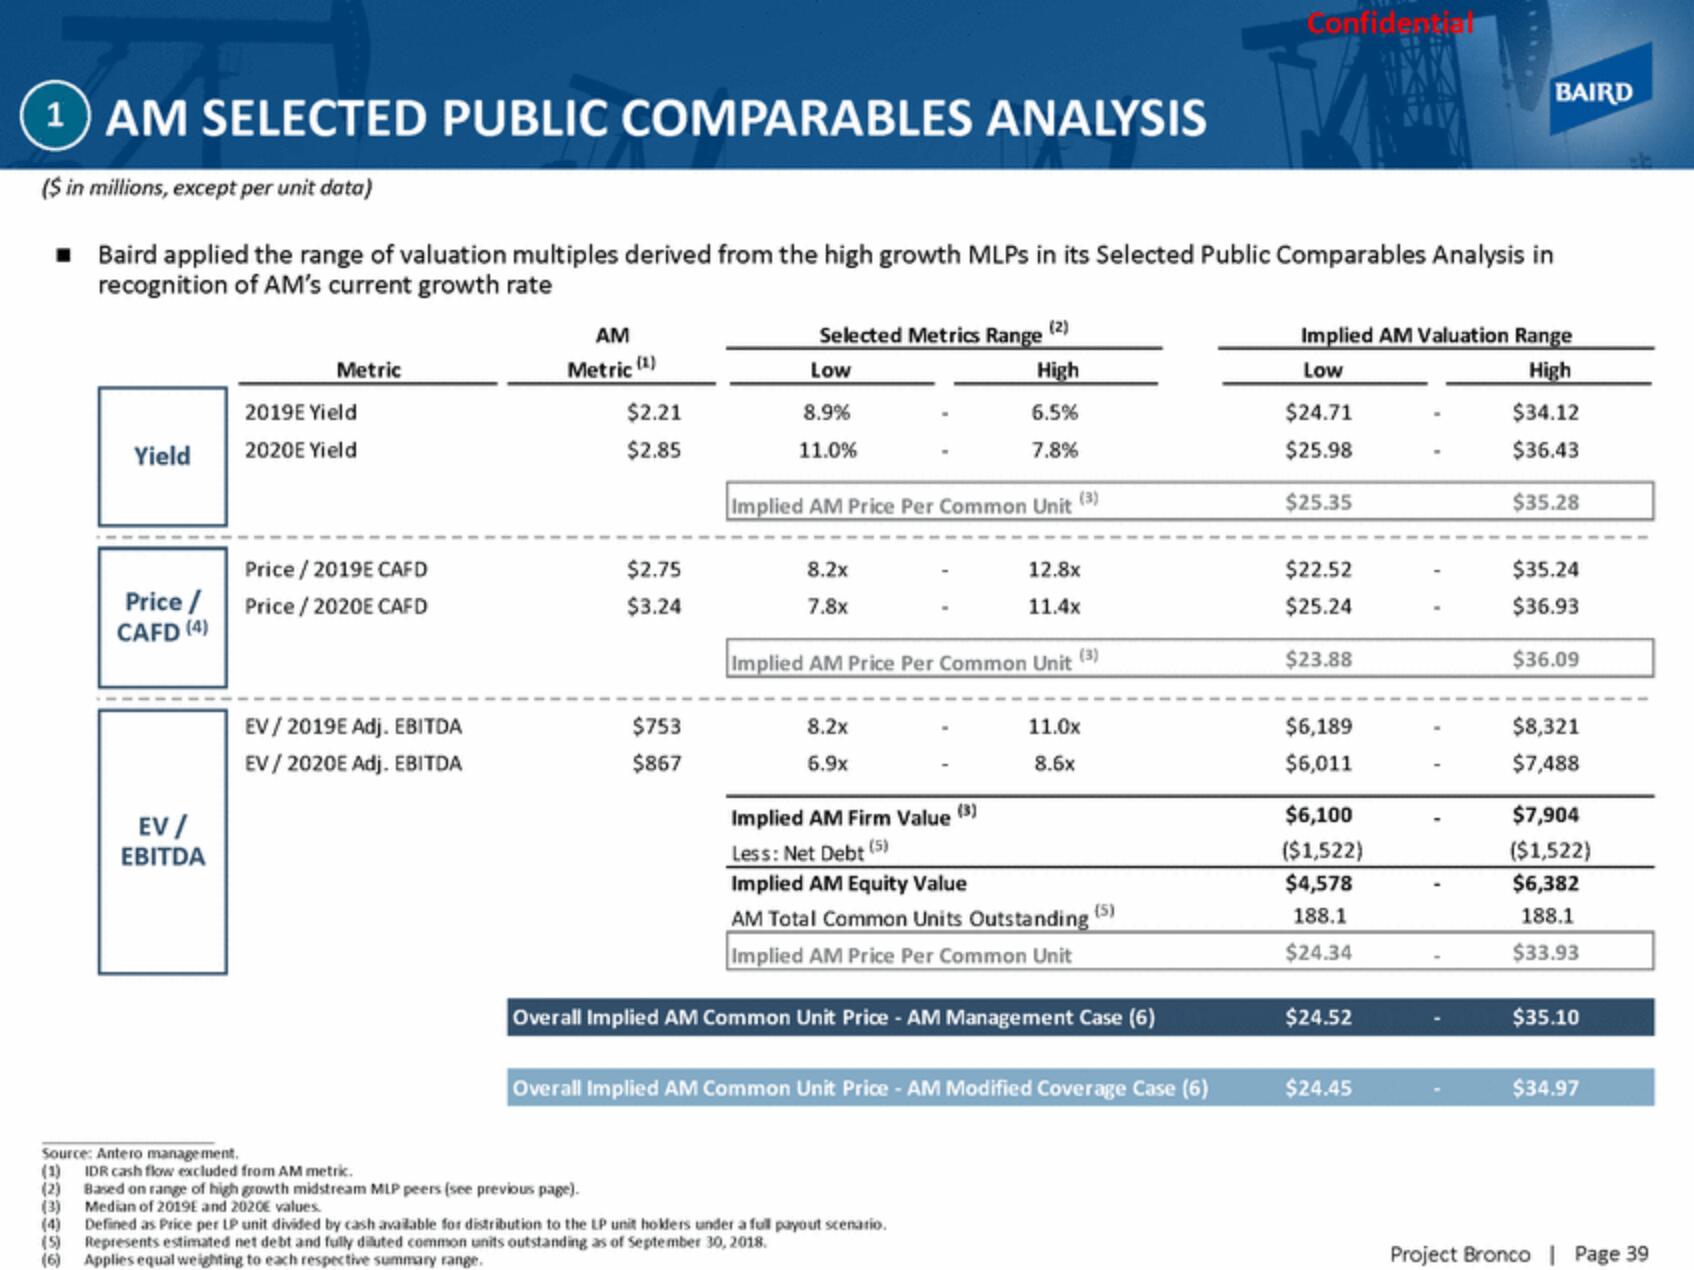
AM SELECTED PUBLIC COMPARABLES ANALYSIS
($ in millions, except per unit data)
■
Baird applied the range of valuation multiples derived from the high growth MLPs in its Selected Public Comparables Analysis in
recognition of AM's current growth rate
(1)
(2)
(3)
(4)
Yield
(5)
(6)
Price /
CAFD (4)
Source: Antero management.
EV/
EBITDA
Metric
2019E Yield
2020E Yield
Price / 2019E CAFD
Price / 2020E CAFD
EV/2019E Adj. EBITDA
EV/ 2020E Adj. EBITDA
AM
Metric (1)
$2.21
$2.85
$2.75
$3.24
IDR cash flow excluded from AM metric.
Based on range of high growth midstream MLP peers (see previous page).
Median of 2019E and 2020E values.
$753
$867
Selected Metrics Range (2)
Low
High
6.5%
7.8%
8.9%
11.0%
Implied AM Price Per Common Unit
(3)
8.2x
7.8x
Implied AM Price Per Common Unit
(3)
8.2x
6.9x
12.8x
11.4x
Implied AM Firm Value
Less: Net Debt (5)
Implied AM Equity Value
AM Total Common Units Outstanding
Implied AM Price Per Common Unit
Overall Implied AM Common Unit Price - AM Management Case (6)
11.0x
8.6x
Defined as Price per LP unit divided by cash available for distribution to the LP unit holders under a full payout scenario.
Represents estimated net debt and fully diluted common units outstanding as of September 30, 2018.
Applies equal weighting to each respective summary range.
Overall Implied AM Common Unit Price - AM Modified Coverage Case (6)
(5)
Confidential
Implied AM Valuation Range
Low
High
$24.71
$25.98
$25.35
$22.52
$25.24
$23.88
$6,189
$6,011
$6,100
($1,522)
$4,578
188.1
$24.34
$24.52
BAIRD
$24.45
$34.12
$36.43
$35.28
$35.24
$36.93
$36.09
$8,321
$7,488
$7,904
($1,522)
$6,382
188.1
$33.93
$35.10
$34.97
Project Bronco | Page 39View entire presentation