TPG Results Presentation Deck
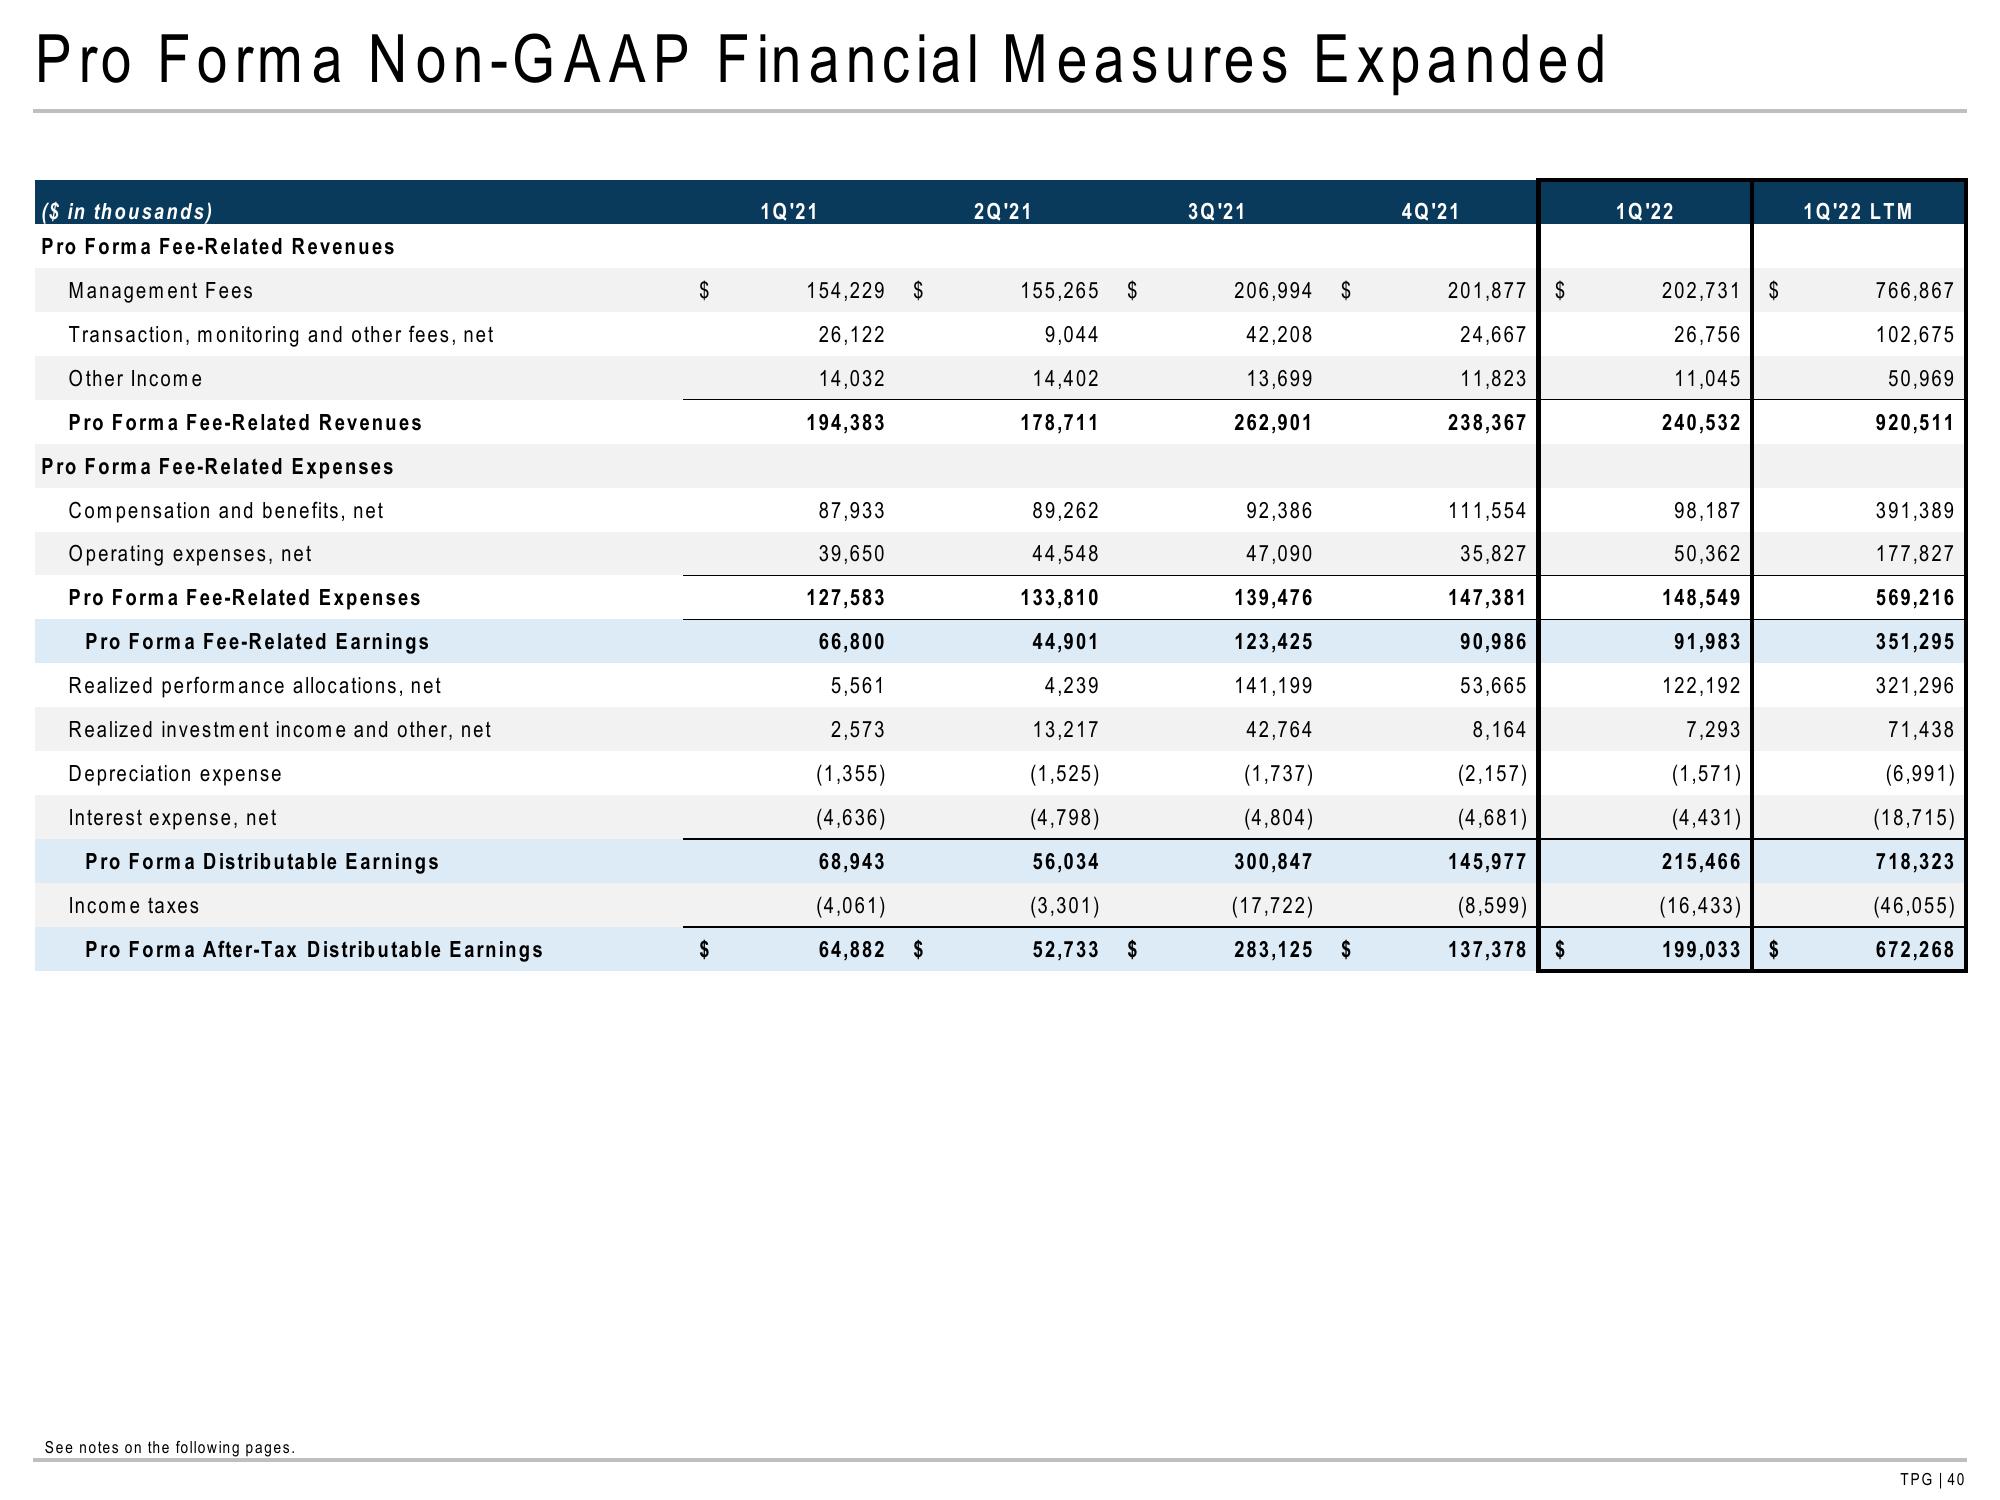
Pro Forma Non-GAAP Financial Measures Expanded
($ in thousands)
Pro Forma Fee-Related Revenues
Management Fees
Transaction, monitoring and other fees, net
Other Income
Pro Forma Fee-Related Revenues
Pro Forma Fee-Related Expenses
Compensation and benefits, net
Operating expenses, net
Pro Forma Fee-Related Expenses
Pro Forma Fee-Related Earnings
Realized performance allocations, net
Realized investment income and other, net
Depreciation expense
Interest expense, net
Pro Forma Distributable Earnings
Income taxes
Pro Forma After-Tax Distributable Earnings
See notes on the following pages.
$
$
1Q'21
154,229
26,122
14,032
194,383
87,933
39,650
127,583
66,800
5,561
2,573
(1,355)
(4,636)
68,943
(4,061)
64,882
$
$
2Q'21
155,265 $
9,044
14,402
178,711
89,262
44,548
133,810
44,901
4,239
13,217
(1,525)
(4,798)
56,034
(3,301)
52,733
$
3Q'21
206,994 $
42,208
13,699
262,901
92,386
47,090
139,476
123,425
141,199
42,764
(1,737)
(4,804)
300,847
(17,722)
283,125
$
4Q'21
201,877 $
24,667
11,823
238,367
111,554
35,827
147,381
90,986
53,665
8,164
(2,157)
(4,681)
145,977
(8,599)
137,378
$
1Q'22
202,731
26,756
11,045
240,532
98,187
50,362
148,549
91,983
122,192
7,293
(1,571)
(4,431)
215,466
(16,433)
199,033
$
$
1Q'22 LTM
766,867
102,675
50,969
920,511
391,389
177,827
569,216
351,295
321,296
71,438
(6,991)
(18,715)
718,323
(46,055)
672,268
TPG | 40View entire presentation