Deutsche Bank Results Presentation Deck
Private Bank
In € m, unless stated otherwise
Financial results
Statement of income
Revenues
Revenues ex-specific items¹
Provision for credit losses
Noninterest expenses
Adjusted costs
Pre-provision profit
Profit (loss) before tax
Balance sheet and resources
Assets under management, in € bn²
Loans, in € bn³
Deposits, in € bn
Leverage exposure, in € bn.
Risk-weighted assets, in € bn
Provision for credit losses, in bps of
average loans4
Performance measures and ratios.
Net interest margin
Cost/income ratio.
ROTE5
Q1 2023
Note: for footnotes refer to slides 45 and 46
Deutsche Bank
Investor Relations
2,438
2,438
267
1,891
1,858
547
280
A vs.
A vs.
Q1 2022 Q4 2022
2.3%
78%
5.3%
10%
(3)%
10%
11%
164%
19%
10%
7%
5%
4%
11% (25)%
(29)% (45)%
531
2%
263
(1)%
310
(2)%
340
(1)%
87
(0)%
40 25bps 7bps
(3)%
2%
(2)%
4%
0%
0.5ppt 0.1ppt
(0)ppt
7ppt
(3.2)ppt (5.2)ppt
Revenue and AuM performance
Revenues
Q1 2023 results
April 27, 2023
PB
Germany
Int.
Private
Bank
Private
Bank
PB GY- Deposits
XX% Excluding specific items¹
518
110
73
127
888
AuM, in € bn6
209
Q4 2022
1,550
531
109
72
135
215
Q1 2023
IPB - Deposits
2,438
A vs. Q1
2022
14% 14%
3%
4%
10% 10%
Net flows, in € bn6
6.1
3.9
3.6
(0.8)
- (0.7)
Q1 2023
PB GY - Inv. products
Key highlights
IPB - Inv. products
/
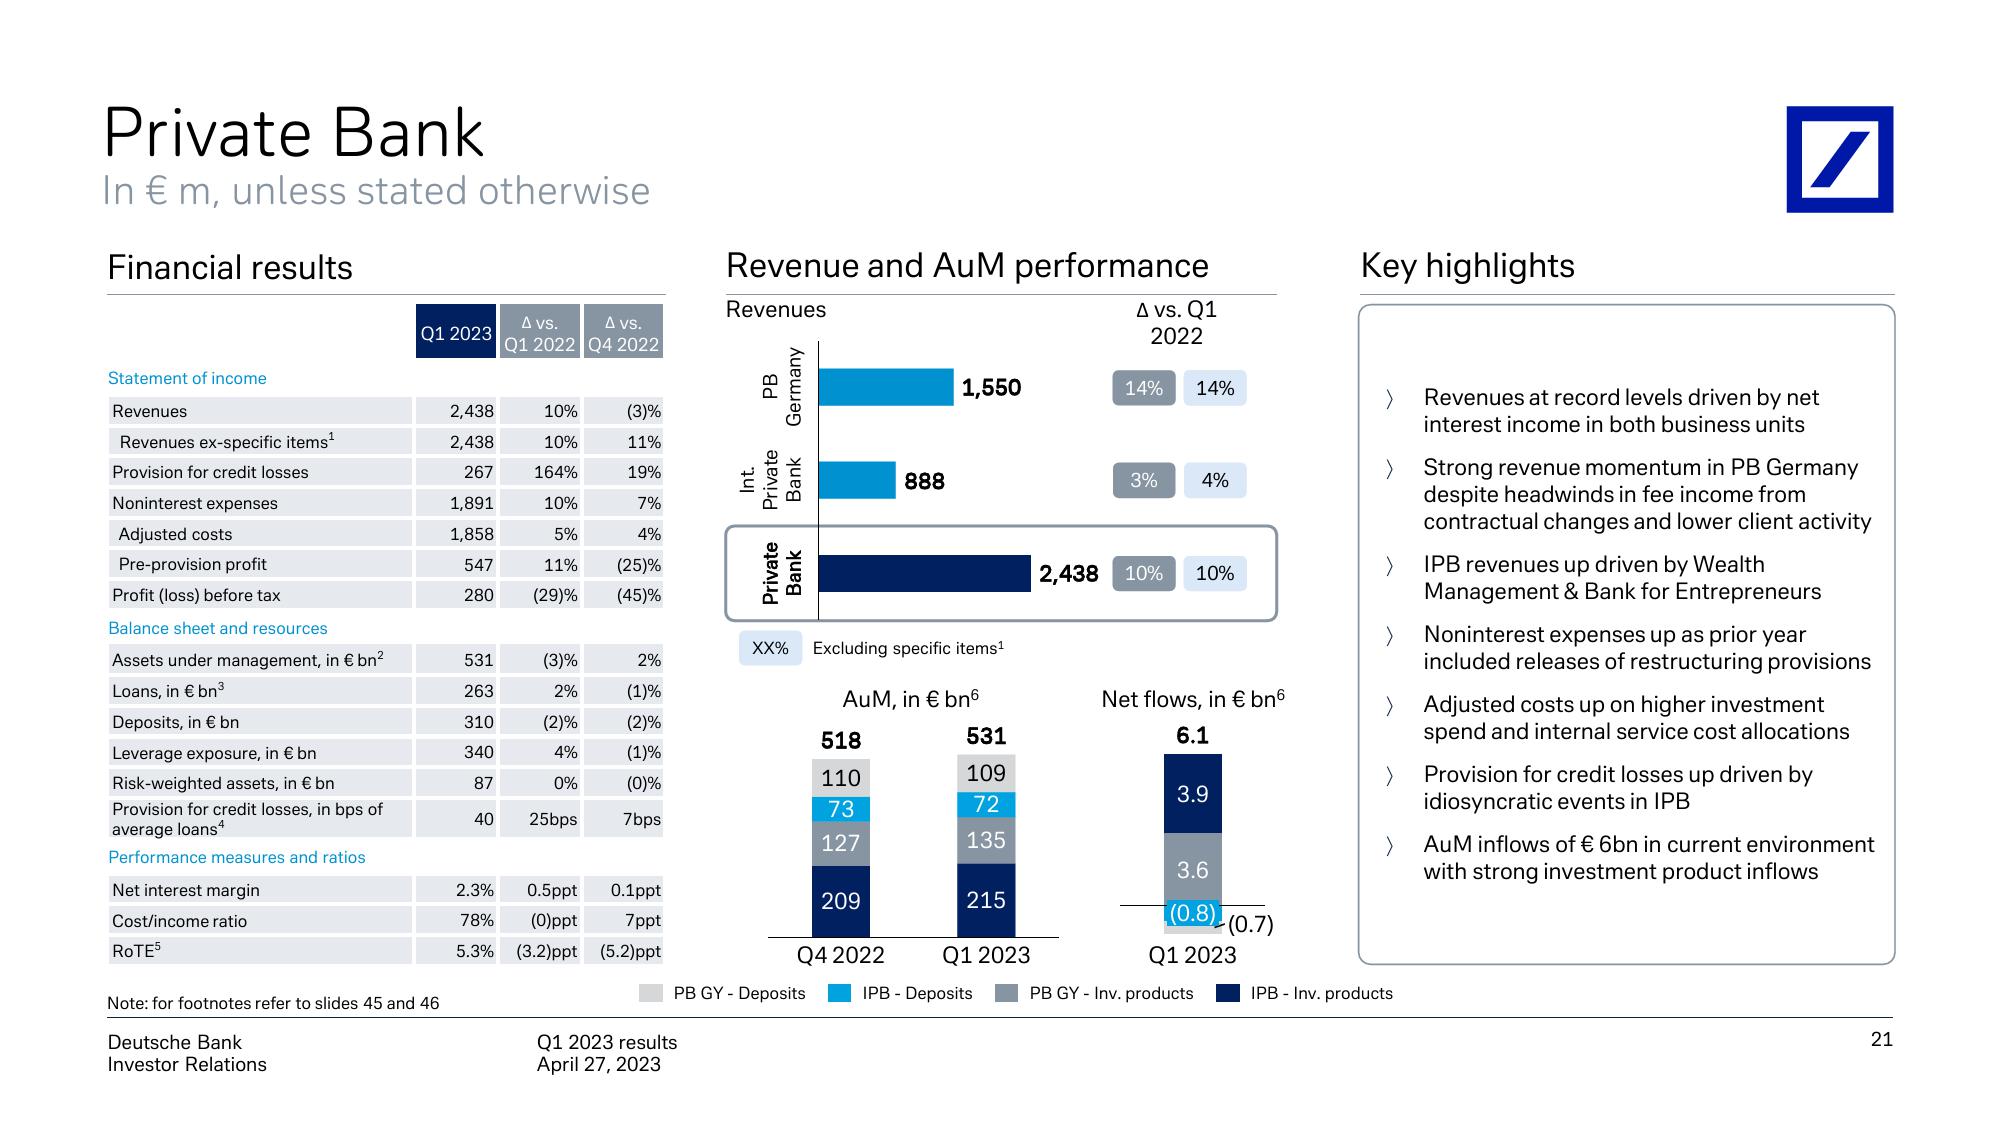
Revenues at record levels driven by net
interest income in both business units
Strong revenue momentum in PB Germany
despite headwinds in fee income from
contractual changes and lower client activity
IPB revenues up driven by Wealth
Management & Bank for Entrepreneurs
Noninterest expenses up as prior year
included releases of restructuring provisions
Adjusted costs up on higher investment
spend and internal service cost allocations
Provision for credit losses up driven by
idiosyncratic events in IPB
AuM inflows of € 6bn in current environment
with strong investment product inflows
21View entire presentation