Melrose Results Presentation Deck
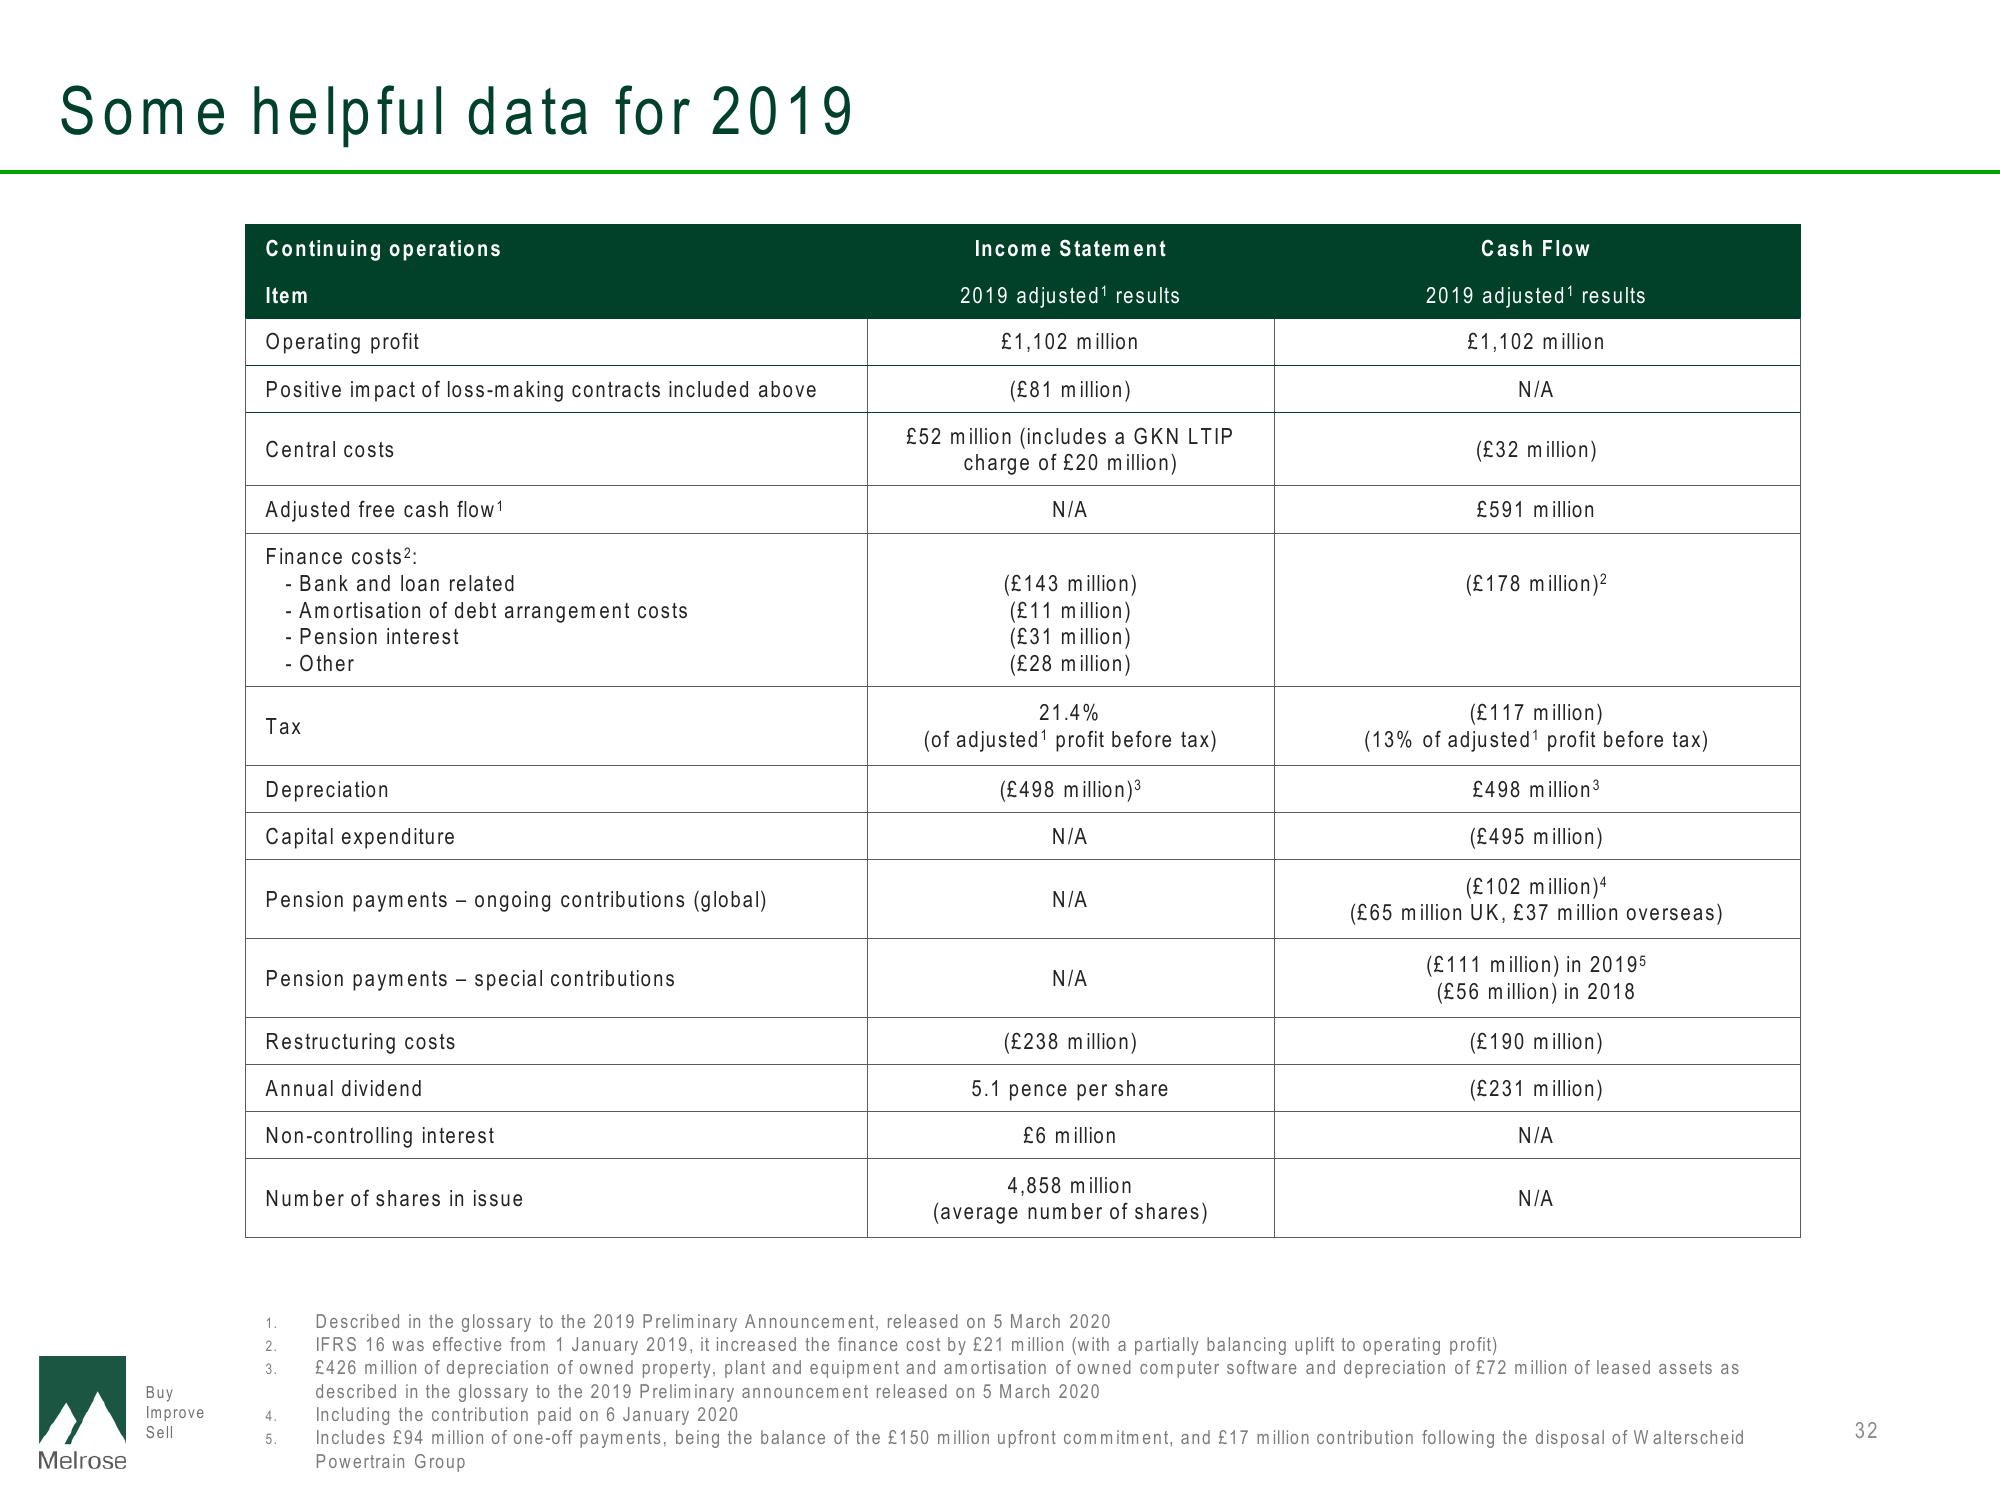
Some helpful data for 2019
Melrose
Buy
Improve
Sell
Continuing operations
Item
Operating profit
Positive impact of loss-making contracts included above
Central costs
Adjusted free cash flow ¹
Finance costs²:
- Bank and loan related
- Amortisation of debt arrangement costs
- Pension interest
- Other
Tax
Depreciation
Capital expenditure
Pension payments - ongoing contributions (global)
Pension payments - special contributions
Restructuring costs
Annual dividend
Non-controlling interest
Number of shares in issue
1.
2.
3.
Income Statement
2019 adjusted¹ results
£1,102 million
(£81 million)
£52 million (includes a GKN LTIP
charge of £20 million)
N/A
(£143 million)
(£11 million)
(£31 million)
(£28 million)
21.4%
(of adjusted¹ profit before tax)
(£498 million) ³
N/A
N/A
N/A
(£238 million)
5.1 pence per share
£6 million
4,858 million
(average number of shares)
Cash Flow
2019 adjusted¹ results
£1,102 million
N/A
(£32 million)
£591 million
(£178 million)²
(£117 million)
(13% of adjusted¹ profit before tax)
£498 million ³
(£495 million)
(£102 million) 4
(£65 million UK, £37 million overseas)
(£111 million) in 20195
(£56 million) in 2018
(£190 million)
(£231 million)
N/A
N/A
Described in the glossary to the 2019 Preliminary Announcement, released on 5 March 2020
IFRS 16 was effective from 1 January 2019, it increased the finance cost by £21 million (with a partially balancing uplift to operating profit)
£426 million of depreciation of owned property, plant and equipment and amortisation of owned computer software and depreciation of £72 million of leased assets as
described in the glossary to the 2019 Preliminary announcement released on 5 March 2020
4. Including the contribution paid on 6 January 2020
5.
Includes £94 million of one-off payments, being the balance of the £150 million upfront commitment, and £17 million contribution following the disposal of Walterscheid
Powertrain Group
32View entire presentation