Cboe Results Presentation Deck
Non-GAAP Information
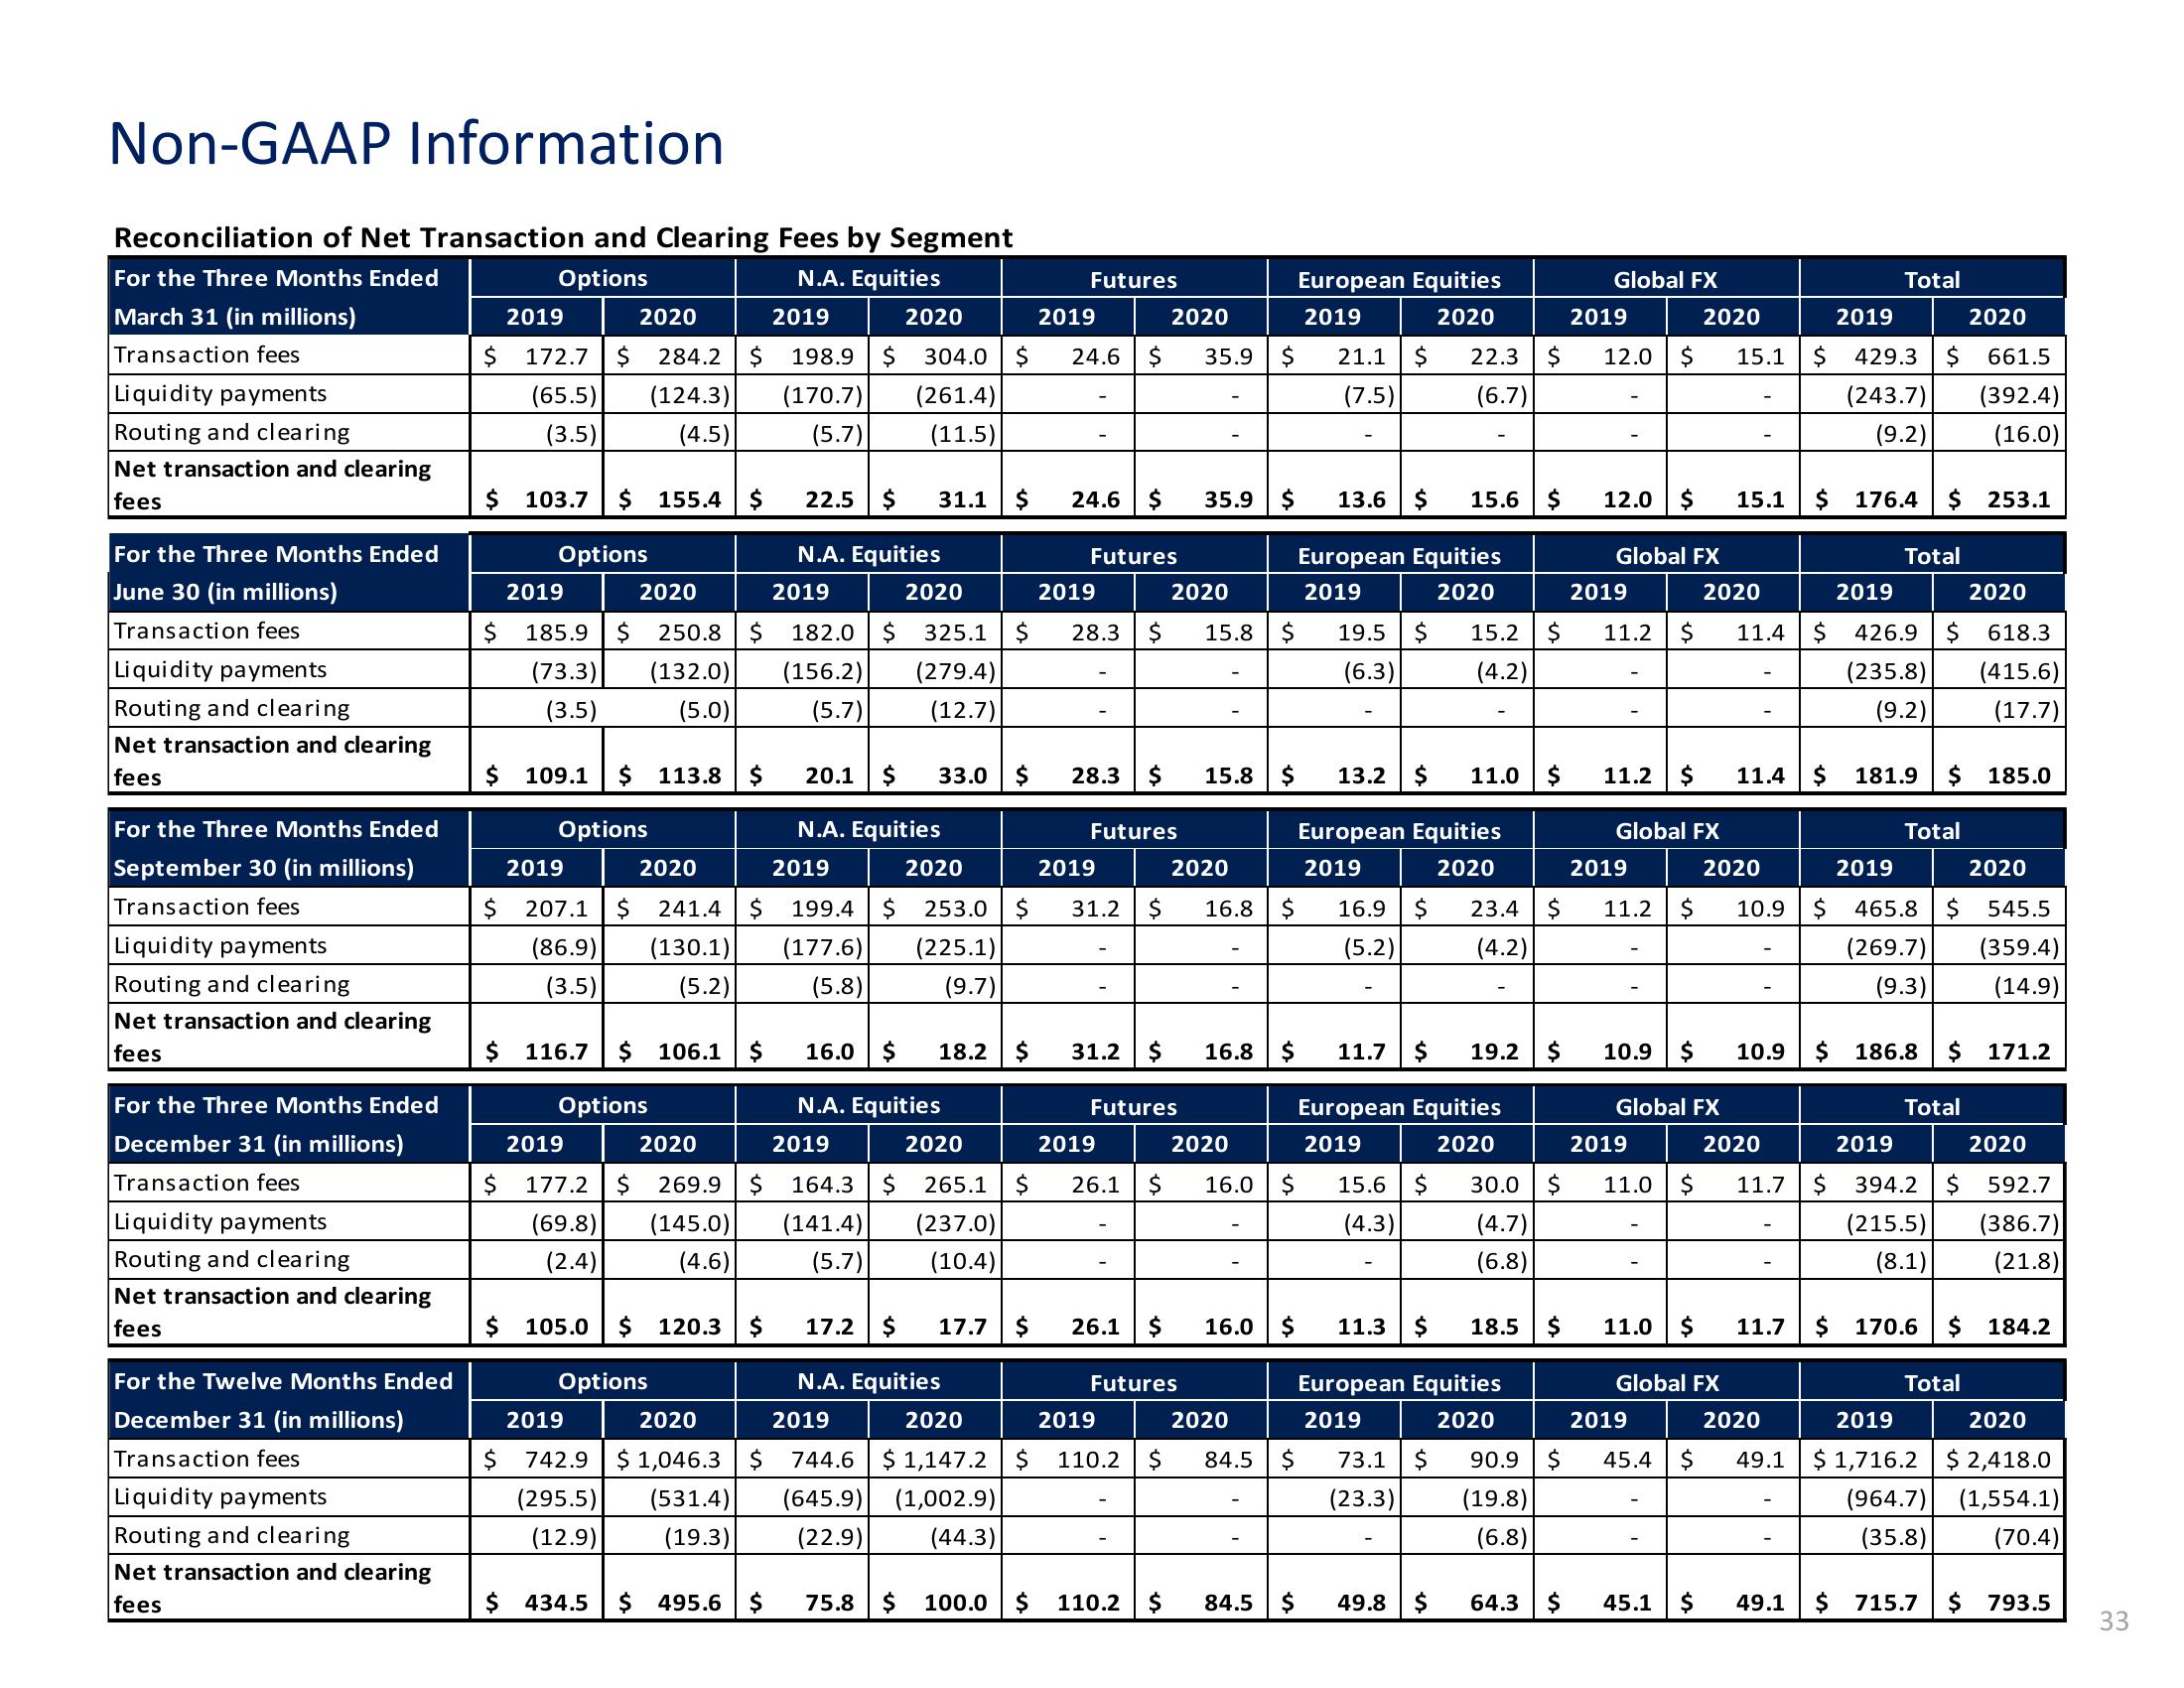
Reconciliation of Net Transaction and Clearing Fees by Segment
For the Three Months Ended
Options
March 31 (in millions)
Transaction fees
N.A. Equities
2020
2019
$ 284.2 $ 198.9 $
(124.3) (170.7)
(4.5) (5.7)
Liquidity payments
Routing and clearing
Net transaction and clearing
fees
For the Three Months Ended
June 30 (in millions)
Transaction fees
Liquidity payments
Routing and clearing
Net transaction and clearing
fees
For the Three Months Ended
September 30 (in millions)
Transaction fees
Liquidity payments
Routing and clearing
Net transaction and clearing
fees
For the Three Months Ended
December 31 (in millions)
Transaction fees
Liquidity payments
Routing and clearing
Net transaction and clearing
fees
For the Twelve Months Ended
December 31 (in millions)
Transaction fees
Liquidity payments
Routing and clearing
Net transaction and clearing
fees
2019
$ 172.7
(65.5)
(3.5)
$ 103.7 $ 155.4 $
Options
2019
$ 185.9
(73.3)
(3.5)
$ 109.1 $ 113.8 $
Options
202
$ 207.1 $ 241.4 $ 199.4
(86.9) (130.1) (177.6)
(3.5) (5.2) (5.8)
$ 116.7 $ 106.1 $
Options
22.5 $
N.A. Equities
2019
2020
2020
2019
250.8 $ 182.0 $ 325.1 $ 28.3 $ 15.8 $
(132.0) (156.2) (279.4)
(5.0)
(5.7)
(12.7)
33.0 $
2019
$ 177.2
(69.8)
(2.4)
$ 105.0 $ 120.3 $
Options
2020
304.0
(261.4)
(11.5)
2019
2020
$ 742.9 $ 1,046.3
(295.5)
(12.9)
20.1 $
N.A. Equities
2019
$ 434.5 $ 495.6 $
31.1
16.0 $ 18.2 $
N.A. Equities
2020
2019
2020
269.9 $164.3 $ 265.1
(145.0) (141.4) (237.0)
(4.6) (5.7) (10.4)
75.8
2019
$ 24.6 $
Futures
$ 24.6 $
17.7
$
2020
253.0 $ 31.2 $
(225.1)
(9.7)
$
Futures
28.3 $
2019
Futures
17.2 $
N.A. Equities
2019
2020
2019
$ 744.6 $ 1,147.2 $ 110.2 $
(531.4) (645.9) (1,002.9)
(19.3) (22.9)
(44.3)
31.2 $
2020
2019
26.1 $
Futures
26.1 $
100.0 $ 110.2 $
35.9
2020
Futures
35.9
$
15.8 $
16.8
2020
020
16.8 $
$
2020
84.5
$
16.0 $
16.0 $
$
84.5 $
European Equities
2019
21.1
(7.5)
$
13.6 $ 15.6
European Equities
2019
2020
19.5 $ 15.2
(6.3)
(4.2)
16.9
(5.2)
2020
22.3
(6.7)
13.2 $
European Equities
2020
$
11.3 $
11.0
23.4
(4.2)
11.7 $ 19.2
European Equities
2019
2020
15.6 $
(4.3)
30.0
(4.7)
(6.8)
18.5 $
European Equities
2019
2020
73.1 $ 90.9
(23.3) (19.8)
(6.8)
49.8 $ 64.3 $
Global FX
2019
12.0
12.0 $
2019
Global FX
2020
11.2 $ 11.4
2020
$ 15.1
Global FX
019
11.2
11.2 $ 11.4 $
15.1
10.9 $ 10.9
2019
Global FX
2019
2020
11.0 $ 11.7
45.4
10.9
11.0 $
Global FX
2020
45.1 $
11.7
49.1
49.1
2019
2020
$ 429.3 $ 661.5
(243.7) (392.4)
(9.2)
(16.0)
$
$
Total
$
176.4 $ 253.1
Total
2019
2020
426.9 $ 618.3
(235.8) (415.6)
(9.2) (17.7)
181.9 $185.0
Total
20
465.8 $ 545.5
(269.7) (359.4)
(9.3) (14.9)
186.8 $ 171.2
Total
2019
394.2
(215.5)
(8.1)
2020
$ 592.7
(386.7)
(21.8)
$ 170.6 $ 184.2
Total
2019
2020
$ 1,716.2 $2,418.0
(964.7) (1,554.1)
(35.8) (70.4)
$ 715.7 $ 793.5
33View entire presentation