ironSource Results Presentation Deck slide image

ironSource Results Presentation Deck

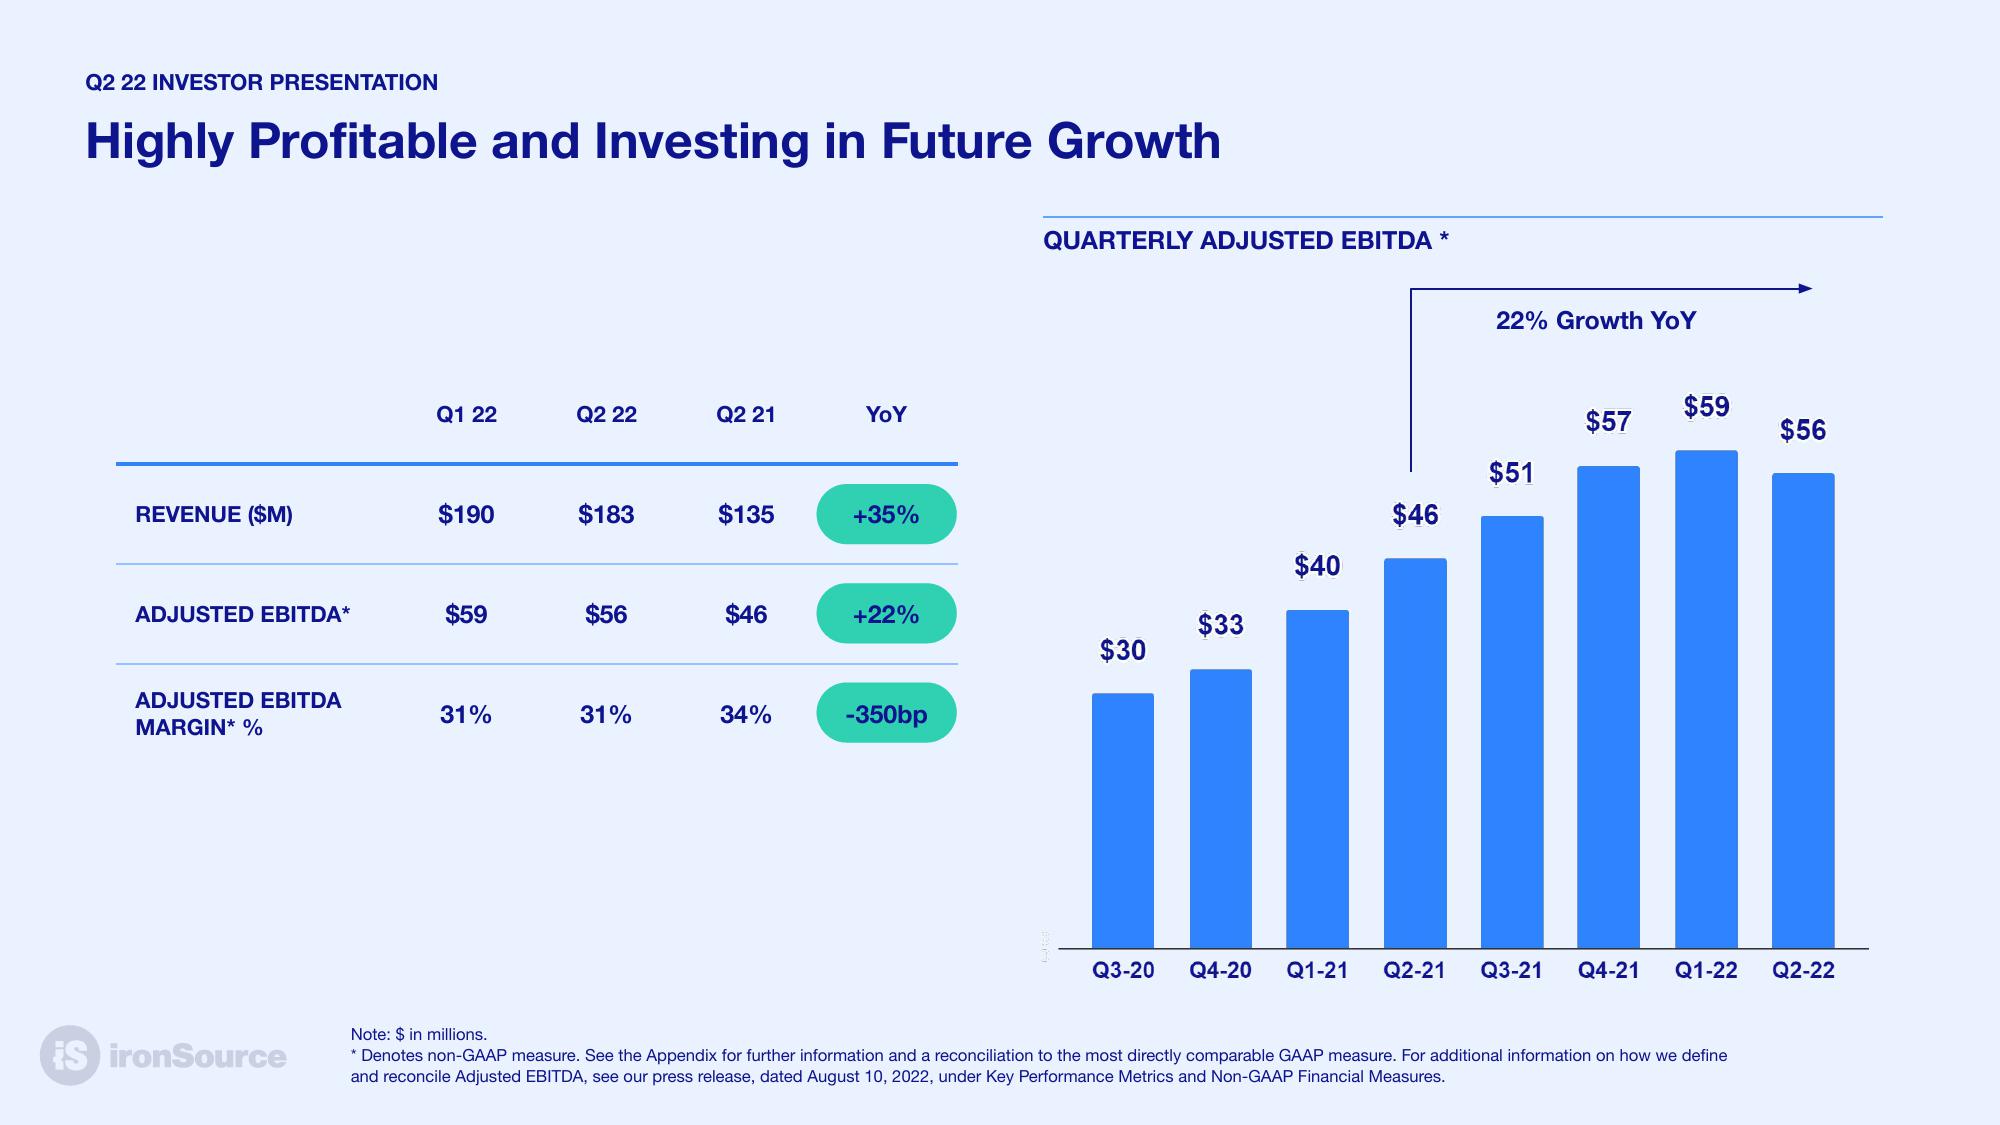
Q2 22 INVESTOR PRESENTATION Highly Profitable and Investing in Future Growth REVENUE ($M) ADJUSTED EBITDA* ADJUSTED EBITDA MARGIN* % iS ironSource Q1 22 $190 $59 31% Q2 22 $183 $56 31% Q2 21 $135 $46 34% YoY +35% +22% -350bp QUARTERLY ADJUSTED EBITDA* $30 Q3-20 $33 $40 $46 22% Growth YoY $51 $57 $59 |||||||||| Q4-20 Q1-21 Q2-21 Q3-21 Q4-21 Q1-22 Note: $ in millions. * Denotes non-GAAP measure. See the Appendix for further information and a reconciliation to the most directly comparable GAAP measure. For additional information on how we define and reconcile Adjusted EBITDA, see our press release, dated August 10, 2022, under Key Performance Metrics and Non-GAAP Financial Measures. $56 Q2-22
View entire presentation