Getty SPAC Presentation Deck
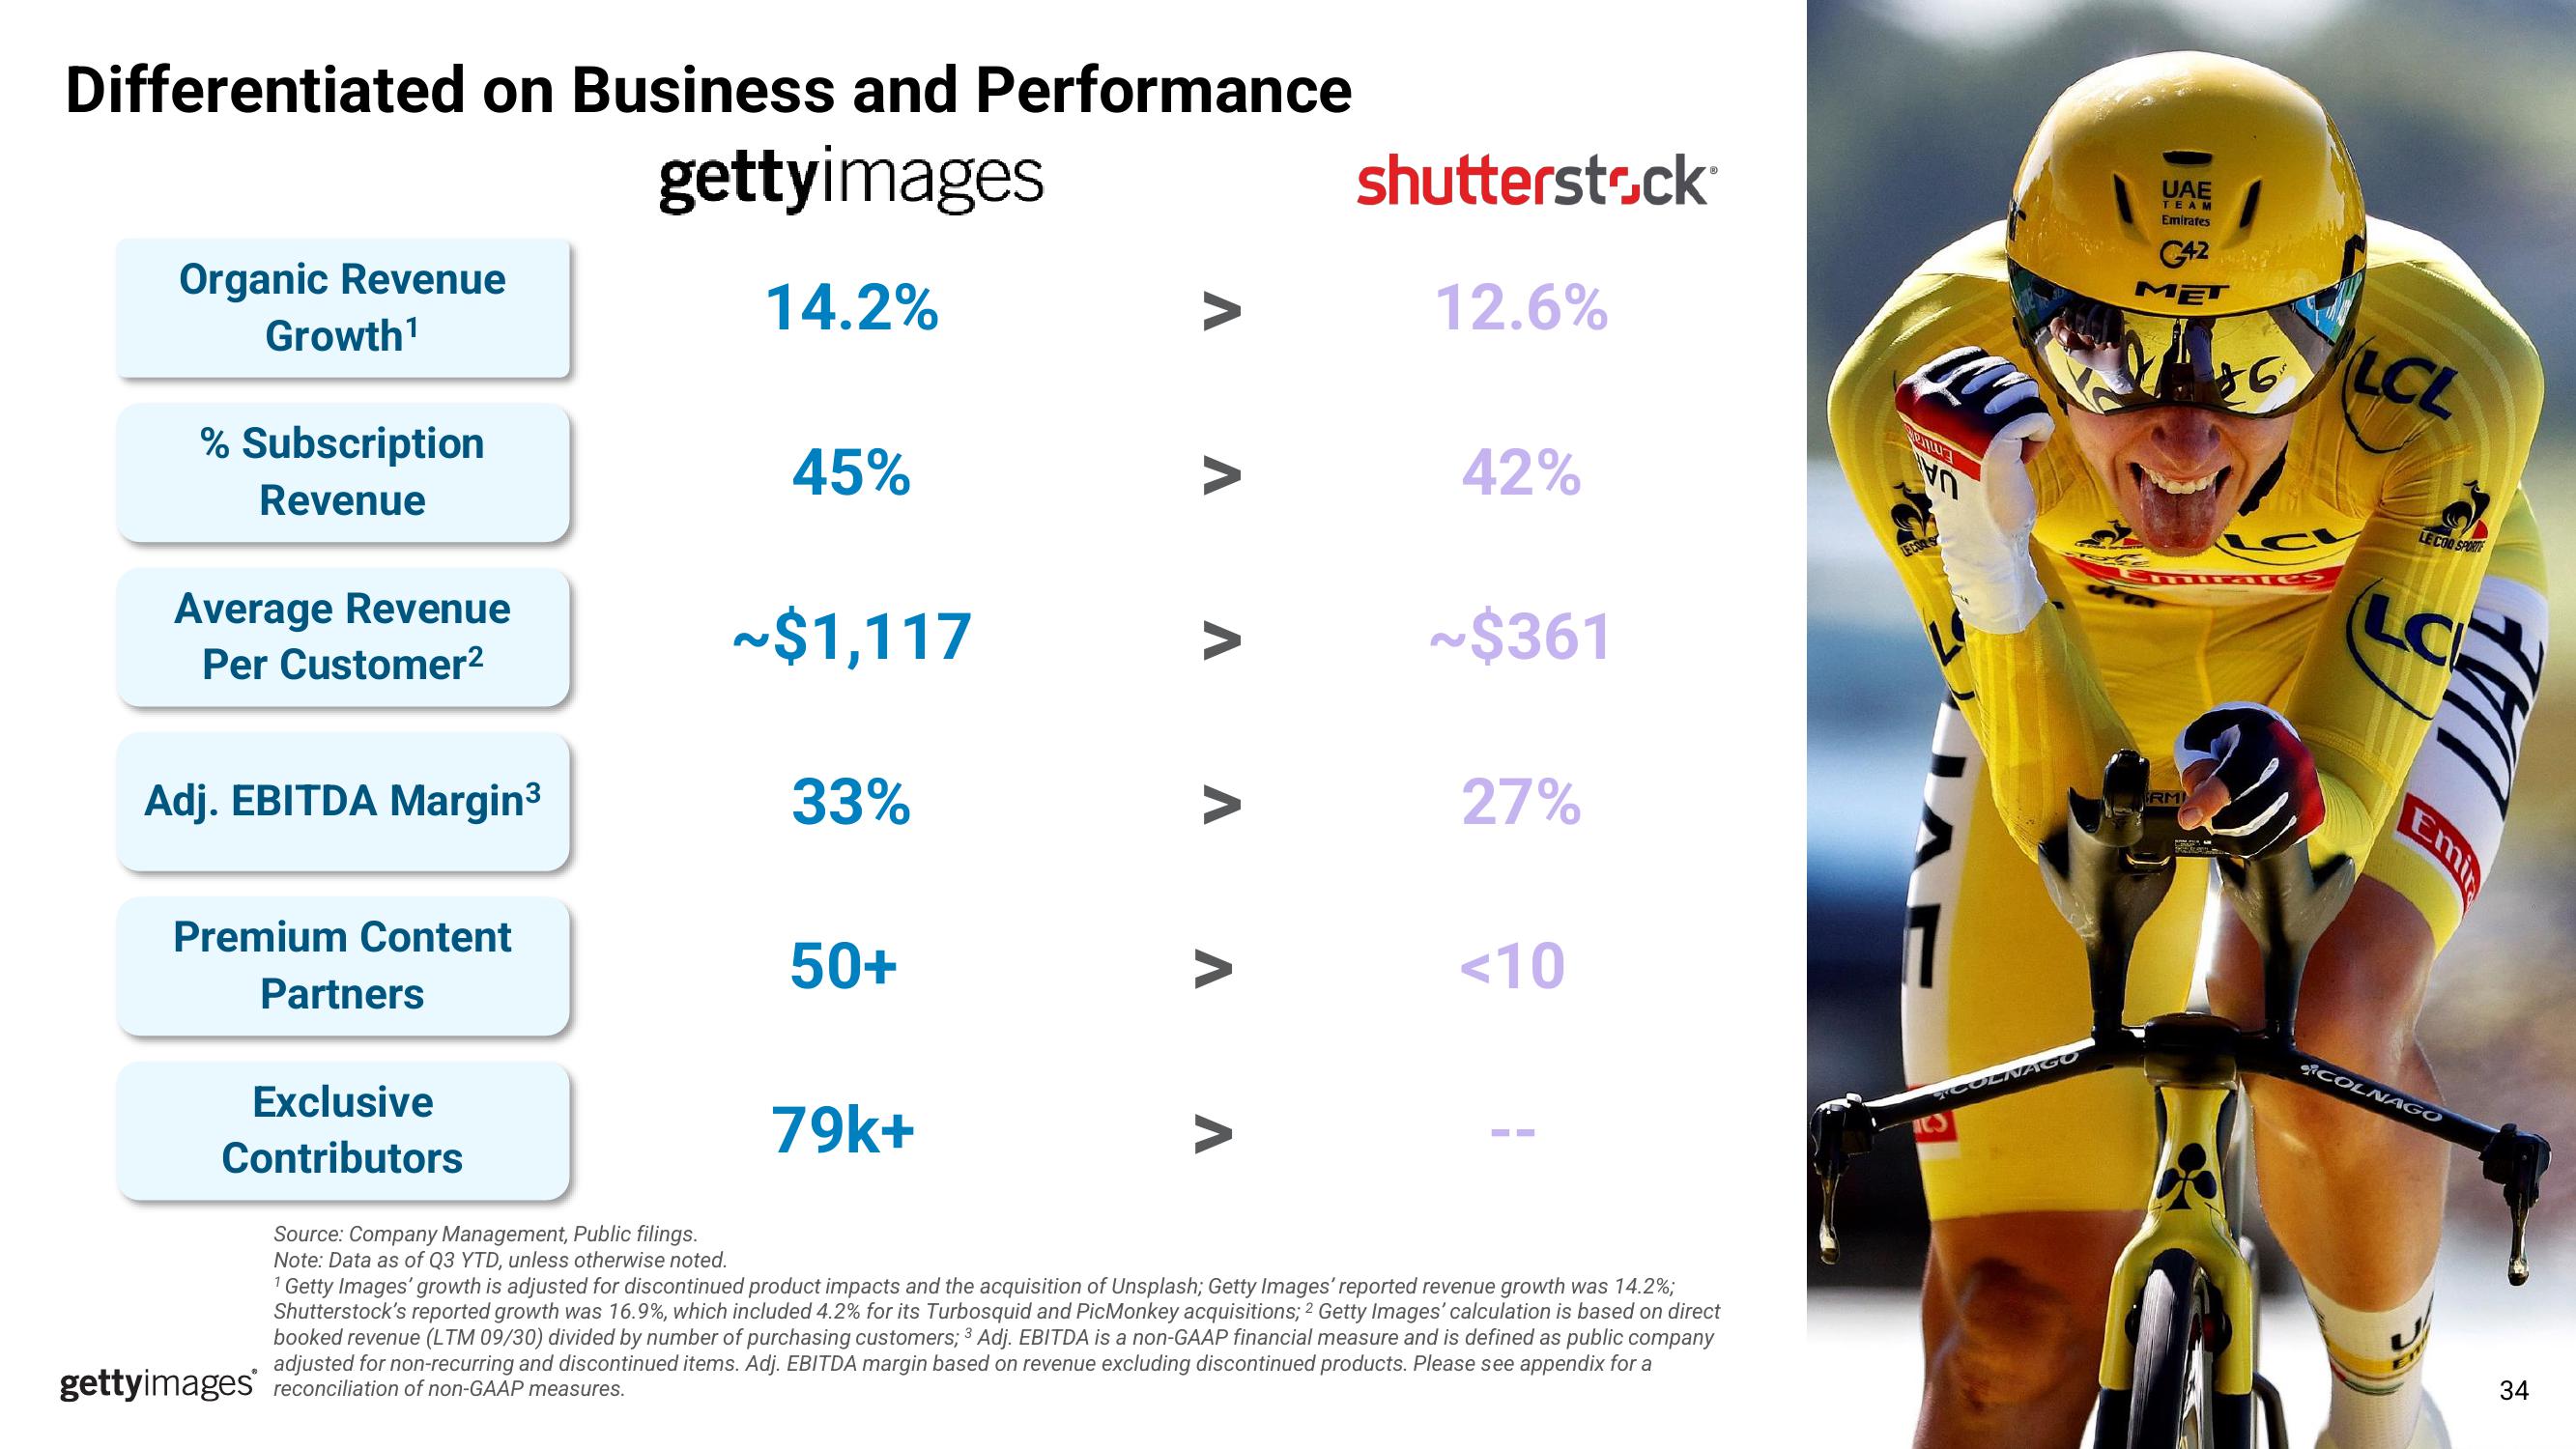
Differentiated on Business and Performance
Organic Revenue
Growth¹
% Subscription
Revenue
Average Revenue
Per Customer²
Adj. EBITDA Margin³
Premium Content
Partners
Exclusive
Contributors
gettyimages
14.2%
Source: Company Management, Public filings.
Note: Data as of Q3 YTD, unless otherwise noted.
gettyimages reconciliation of non-GAAP measures.
45%
~$1,117
33%
50+
79k+
A A A A A A
лл
shutterstock
12.6%
42%
~$361
27%
<10
1 Getty Images' growth is adjusted for discontinued product impacts and the acquisition of Unsplash; Getty Images' reported revenue growth was 14.2%;
Shutterstock's reported growth was 16.9%, which included 4.2% for its Turbosquid and PicMonkey acquisitions; 2 Getty Images' calculation is based on direct
booked revenue (LTM 09/30) divided by number of purchasing customers; 3 Adj. EBITDA is a non-GAAP financial measure and is defined as public company
adjusted for non-recurring and discontinued items. Adj. EBITDA margin based on revenue excluding discontinued products. Please see appendix for a
O
LE CORS
TCOLNAGO
TCS
UAE
TEAM
Emirates
C42
MET
RMI
16
nirates
SE
C
LCL
LE COQ SPORTE
LC
Emir
COLNAGO
DAL
34View entire presentation