WeWork Investor Presentation Deck
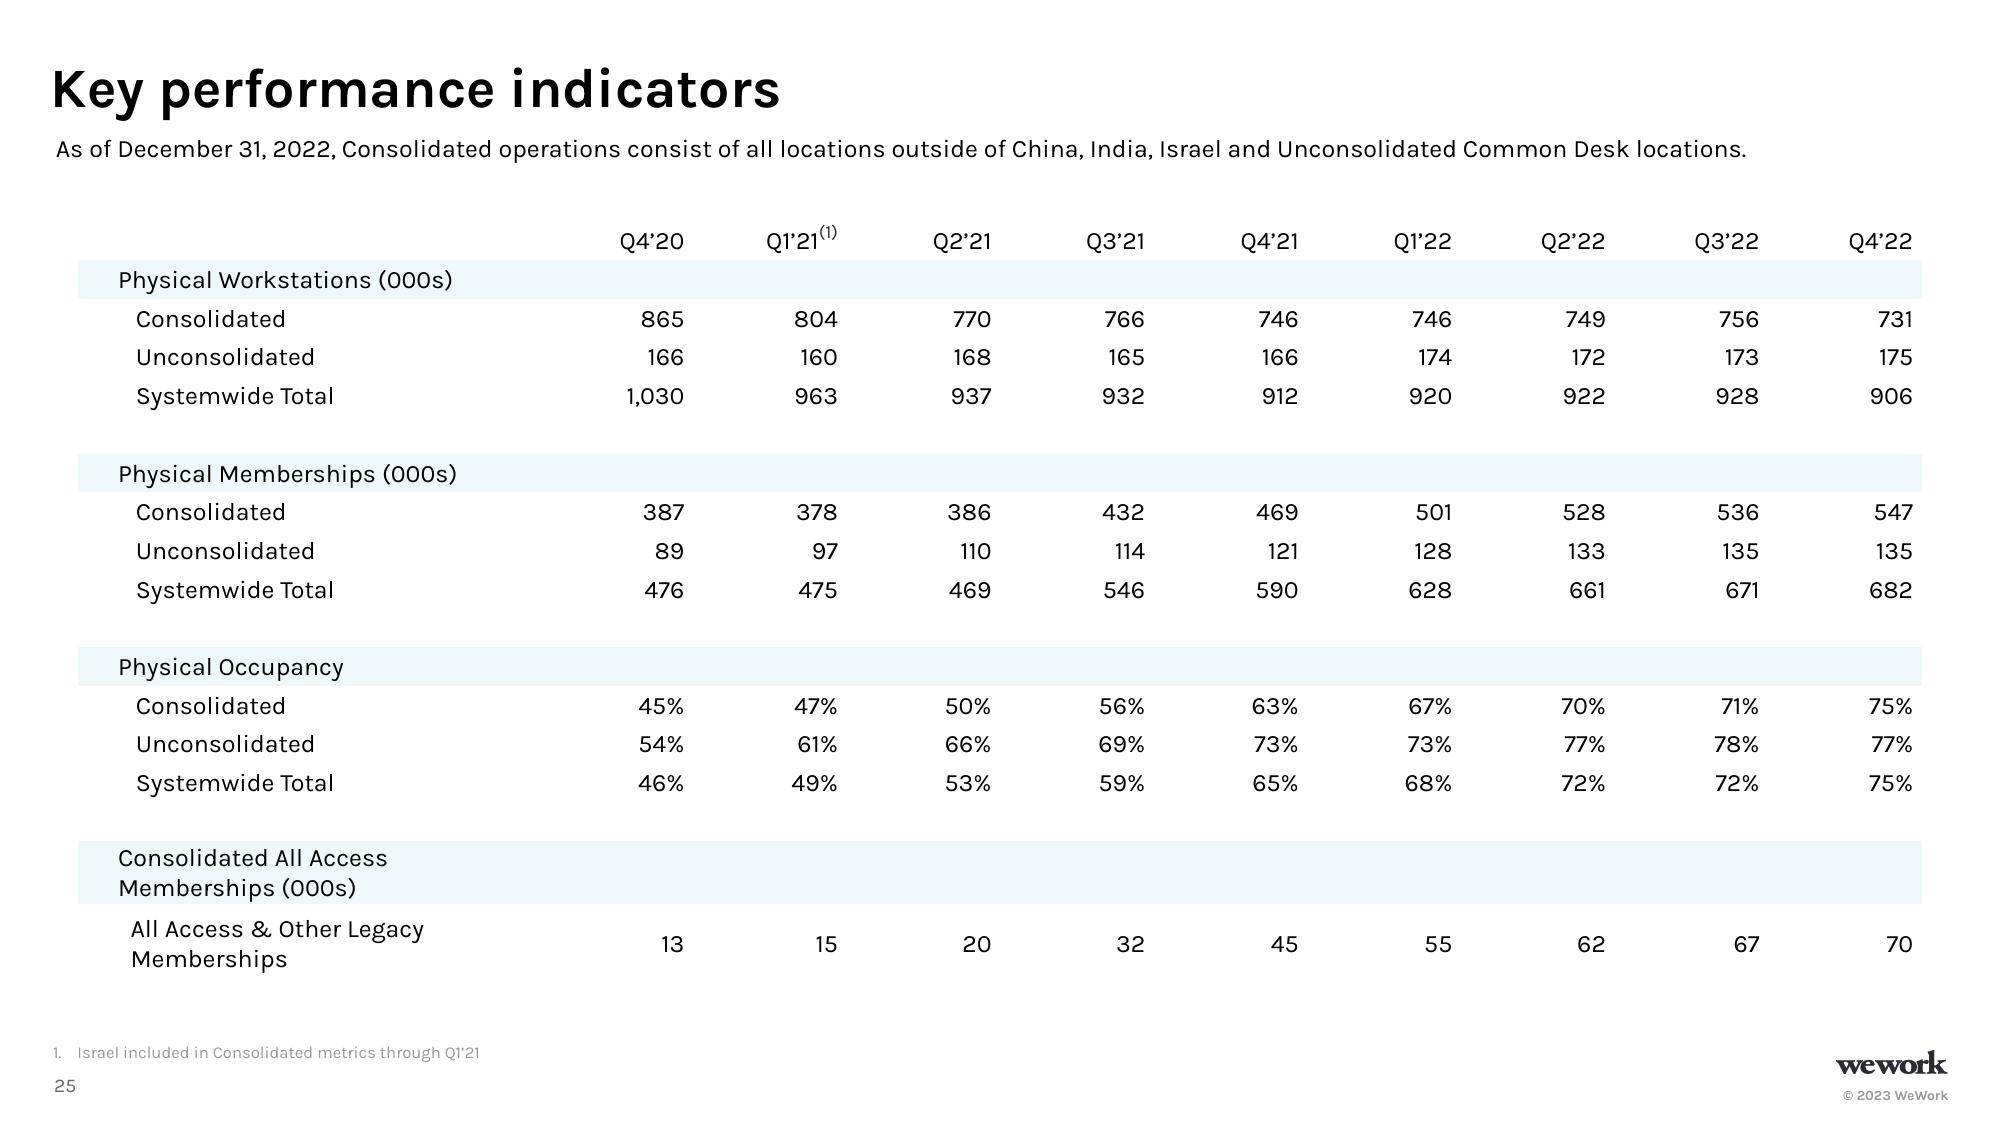
Key performance indicators
As of December 31, 2022, Consolidated operations consist of all locations outside of China, India, Israel and Unconsolidated Common Desk locations.
Physical Workstations (000s)
Consolidated
Unconsolidated
Systemwide Total
Physical Memberships (000s)
Consolidated
Unconsolidated
Systemwide Total
Physical Occupancy
Consolidated
Unconsolidated
Systemwide Total
Consolidated All Access
Memberships (000s)
All Access & Other Legacy
Memberships
1.. Israel included in Consolidated metrics through Q1'21
25
Q4'20
865
166
1,030
387
89
476
45%
54%
46%
13
Q1'21 (1)
804
160
963
378
97
475
47%
61%
49%
15
Q2'21
770
168
937
386
110
469
50%
66%
53%
20
Q3'21
766
165
932
432
114
546
56%
69%
59%
32
Q4'21
746
166
912
469
121
590
63%
73%
65%
45
Q1'22
746
174
920
501
128
628
67%
73%
68%
55
Q2'22
749
172
922
528
133
661
70%
77%
72%
62
Q3'22
756
173
928
536
135
671
71%
78%
72%
67
Q4'22
731
175
906
547
135
682
75%
77%
75%
70
wework
© 2023 WeWorkView entire presentation