MSR Value Growth & Market Trends
SUMMARY 3Q'21 FINANCIAL RESULTS (CONT'D)
●
$23.98
62%
3Q'20
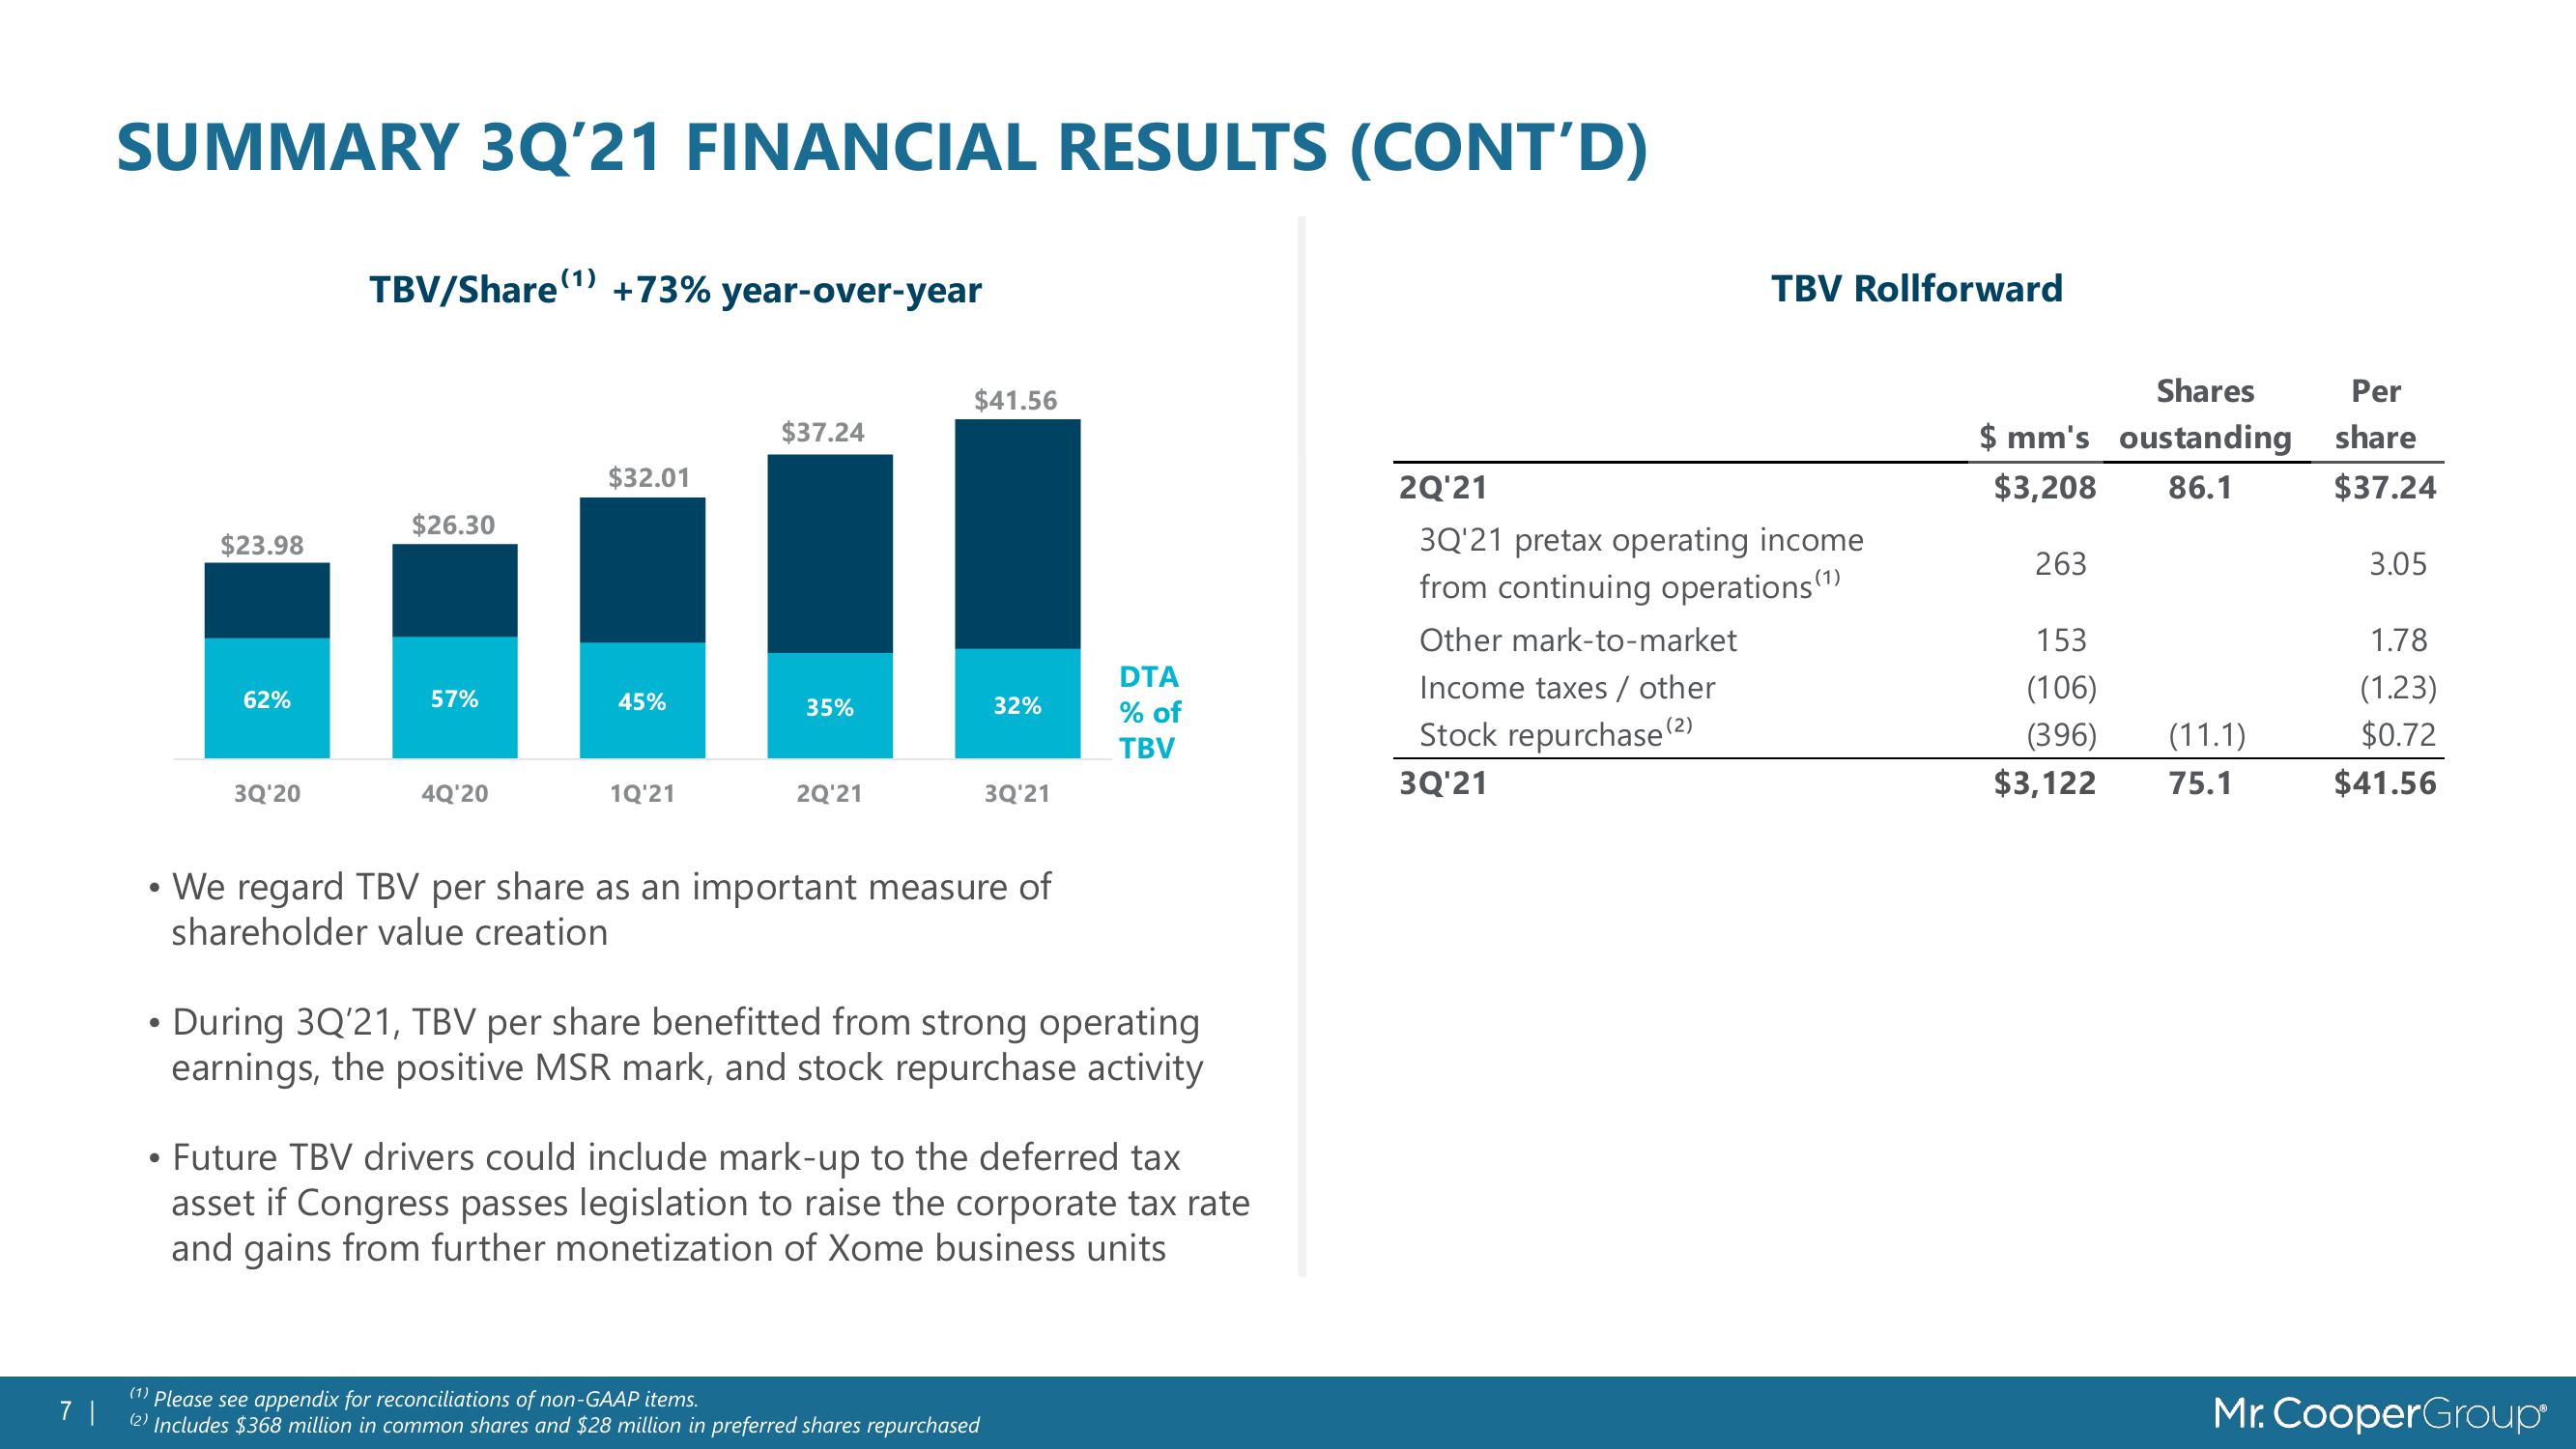
TBV/Share(1) +73% year-over-year
$26.30
57%
4Q'20
$32.01
45%
1Q'21
$37.24
35%
2Q'21
$41.56
32%
3Q'21
We regard TBV per share as an important measure of
shareholder value creation
7 |
(1) Please see appendix for reconciliations of non-GAAP items.
(2) Includes $368 million in common shares and $28 million in preferred shares repurchased
DTA
% of
TBV
• During 3Q'21, TBV per share benefitted from strong operating
earnings, the positive MSR mark, and stock repurchase activity
• Future TBV drivers could include mark-up to the deferred tax
asset if Congress passes legislation to raise the corporate tax rate
and gains from further monetization of Xome business units
TBV Rollforward
2Q'21
3Q'21 pretax operating income
from continuing operations (¹)
Other mark-to-market
Income taxes / other
Stock repurchase (²)
3Q'21
Shares
$ mm's oustanding
$3,208 86.1
263
153
(106)
(396)
$3,122
(11.1)
75.1
Per
share
$37.24
3.05
1.78
(1.23)
$0.72
$41.56
Mr. CooperGroupView entire presentation