WeWork Investor Presentation Deck
(1)
(2)
Drivers of location contribution margin
Location maturity (1)
(3)
(4)
Location contribution margin
as a % of membership and service revenue
10%
Total
Consolidated
15%
(5%)
Non-cash GAAP straight-line lease cost
as a % of membership and service revenue
Benefit of non-cash lease incentives
as a % of membership and service revenue
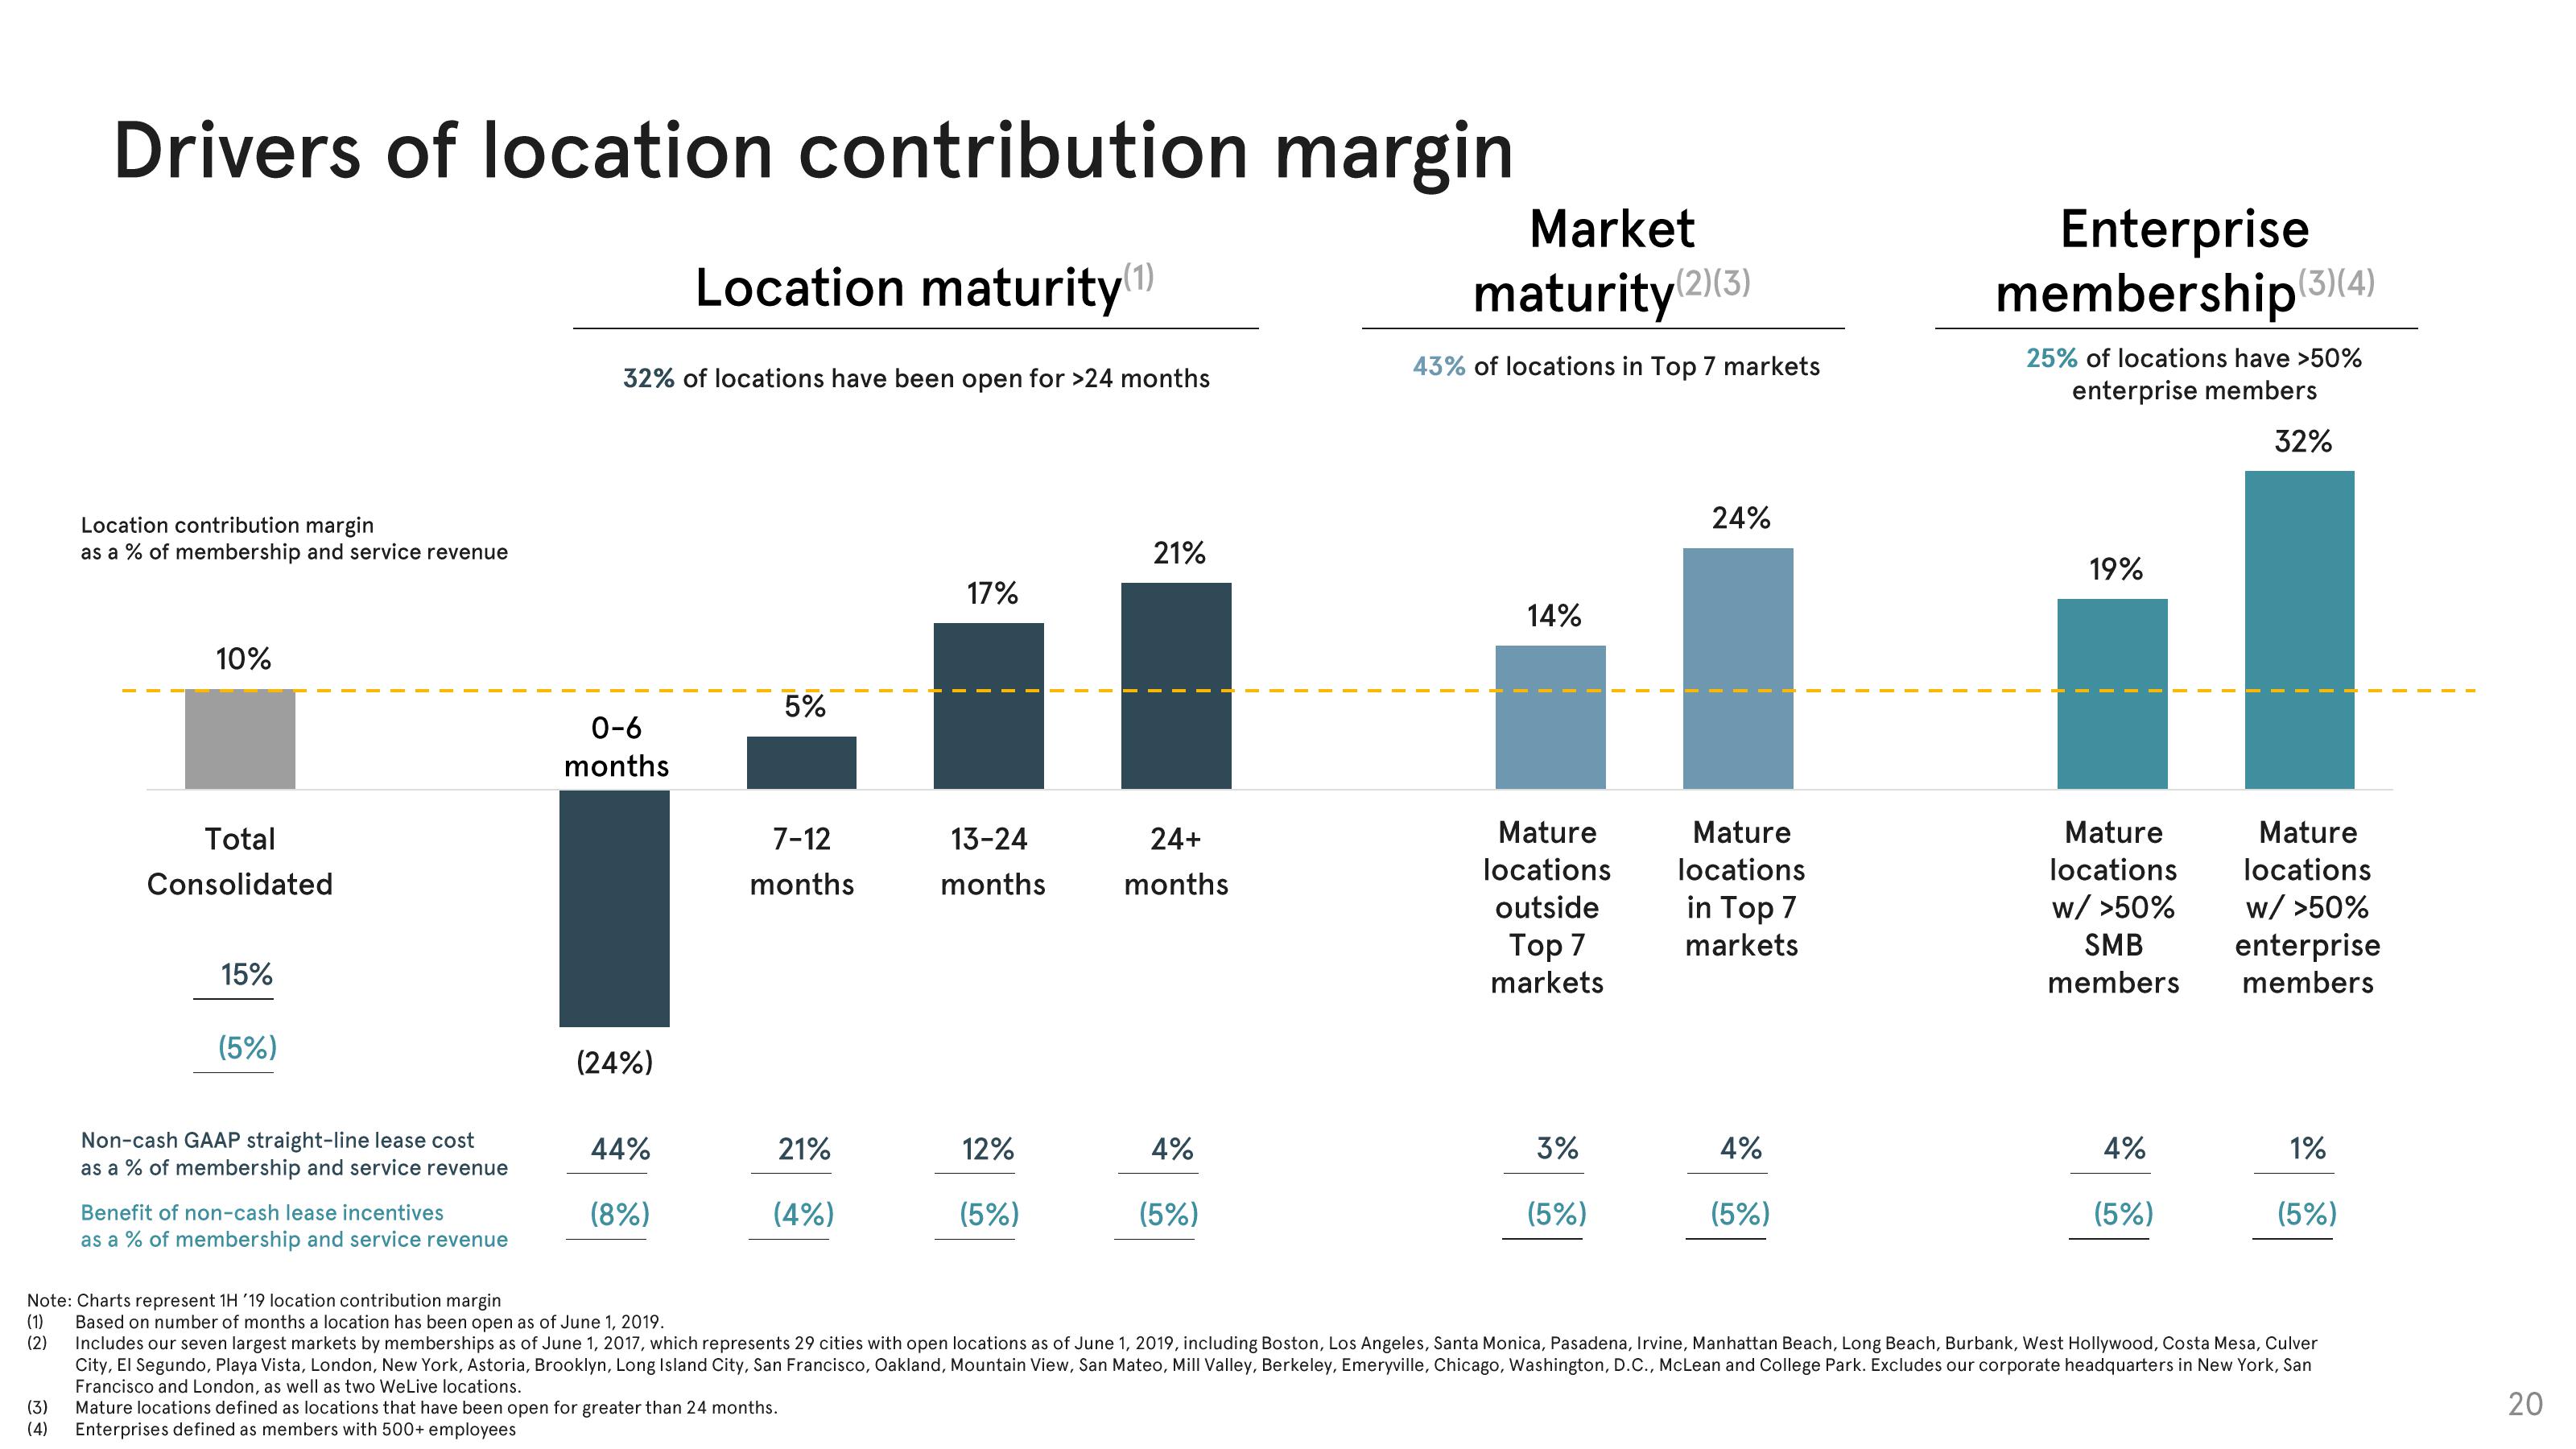
32% of locations have been open for >24 months
0-6
months
(24%)
44%
(8%)
5%
7-12
months
21%
(4%)
17%
13-24
months
12%
(5%)
21%
24+
months
4%
(5%)
Market
maturity(2)(3)
43% of locations in Top 7 markets
14%
Mature
locations
outside
Top 7
markets
3%
(5%)
24%
Mature
locations
in Top 7
markets
4%
(5%)
Enterprise
membership (3) (4)
25% of locations have >50%
enterprise members
32%
19%
Mature
locations
w/ >50%
SMB
members
4%
(5%)
Mature
locations
w/ >50%
enterprise
members
1%
Note: Charts represent 1H '19 location contribution margin
Based on number of months a location has been open as of June 1, 2019.
Includes our seven largest markets by memberships as of June 1, 2017, which represents 29 cities with open locations as of June 1, 2019, including Boston, Los Angeles, Santa Monica, Pasadena, Irvine, Manhattan Beach, Long Beach, Burbank, West Hollywood, Costa Mesa, Culver
City, El Segundo, Playa Vista, London, New York, Astoria, Brooklyn, Long Island City, San Francisco, Oakland, Mountain View, San Mateo, Mill Valley, Berkeley, Emeryville, Chicago, Washington, D.C., McLean and College Park. Excludes our corporate headquarters in New York, San
Francisco and London, as well as two WeLive locations.
Mature locations defined as locations that have been open for greater than 24 months.
Enterprises defined as members with 500+ employees
(5%)
20View entire presentation