Kinnevik Results Presentation Deck
Intro
Categories
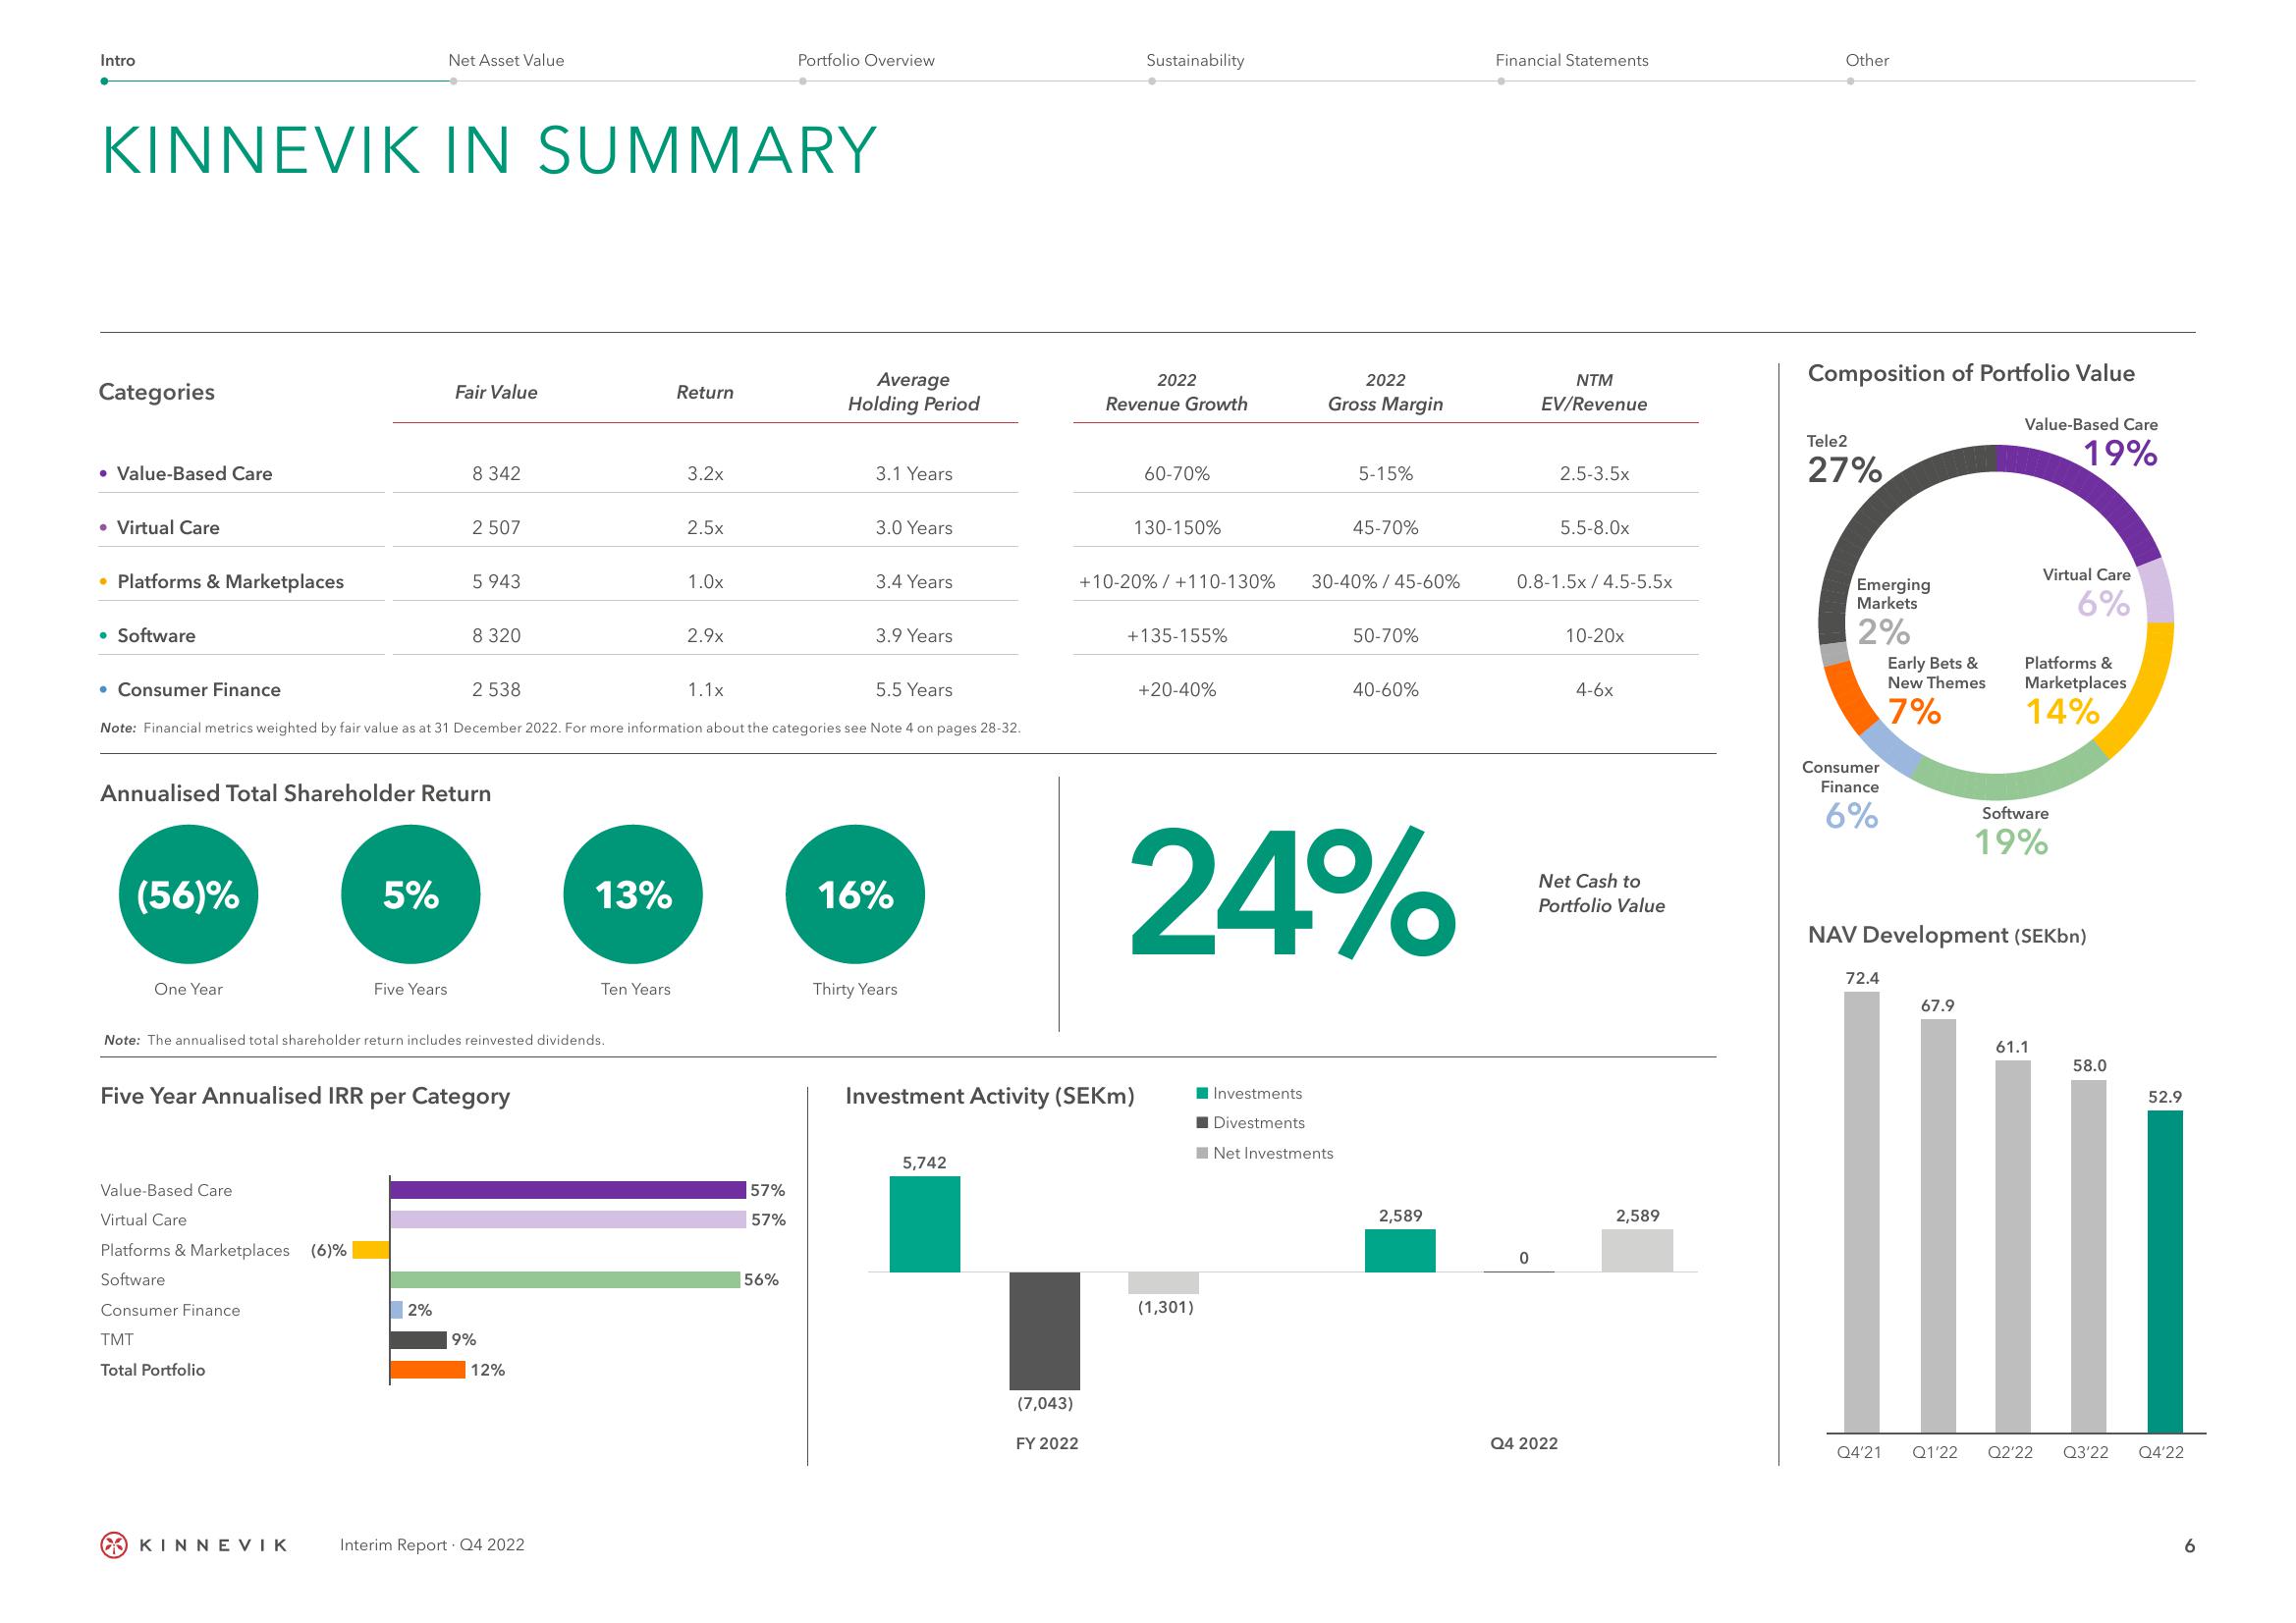
KINNEVIK IN SUMMARY
• Value-Based Care
• Virtual Care
• Platforms & Marketplaces
• Software
(56)%
One Year
Value-Based Care
Virtual Care
Platforms & Marketplaces (6)%
Software
Consumer Finance
Net Asset Value
Annualised Total Shareholder Return
5%
TMT
Total Portfolio
Five Years
KINNEVIK
Fair Value
8 342
2 507
2%
5 943
8 320
Five Year Annualised IRR per Category
Note: The annualised total shareholder return includes reinvested dividends.
2 538
• Consumer Finance
5.5 Years
Note: Financial metrics weighted by fair value as at 31 December 2022. For more information about the categories see Note 4 on pages 28-32.
9%
12%
13%
Interim Report. Q4 2022
Ten Years
Return
3.2x
2.5x
1.0x
2.9x
1.1x
Portfolio Overview
57%
57%
56%
Average
Holding Period
3.1 Years
3.0 Years
3.4 Years
3.9 Years.
16%
Thirty Years
5,742
(7,043)
FY 2022
Sustainability
2022
Revenue Growth
Investment Activity (SEKm)
60-70%
130-150%
+10-20%/ +110-130%
+135-155%
+20-40%
(1,301)
2022
Gross Margin
Investments
Divestments
5-15%
45-70%
30-40% / 45-60%
24%
Net Investments
50-70%
40-60%
2,589
Financial Statements
NTM
EV/Revenue
0
2.5-3.5x
0.8-1.5x/4.5-5.5x
5.5-8.0x
Q4 2022
10-20x
4-6x
Net Cash to
Portfolio Value
2,589
Other
Composition of Portfolio Value
Tele2
27%
Emerging
Markets
2%
Consumer
Finance
6%
Early Bets &
New Themes
7%
72.4
67.9
Value-Based Care
19%
Q4'21 Q1'22
NAV Development (SEKbn)
Virtual Care
6%
Platforms &
Marketplaces
14%
Software
19%
61.1
58.0
52.9
Q2'22 Q3'22 Q4'22
6View entire presentation