J.P.Morgan 2Q23 Investor Results
JPMORGAN CHASE & CO.
CONSUMER & COMMUNITY BANKING
FINANCIAL HIGHLIGHTS
(in millions, except ratio data)
INCOME STATEMENT
REVENUE
Lending- and deposit-related fees
Asset management fees
Mortgage fees and related income
Card income
All other income (a)
Noninterest revenue
Net interest income
TOTAL NET REVENUE
Provision for credit losses
NONINTEREST EXPENSE
Compensation expense
Noncompensation expense (b)
TOTAL NONINTEREST EXPENSE
Income before income tax expense
Income tax expense
NET INCOME
REVENUE BY LINE OF BUSINESS
Banking & Wealth Management
Home Lending
Card Services & Auto
MORTGAGE FEES AND RELATED INCOME DETAILS
Production revenue
Net mortgage servicing revenue (c)
Mortgage fees and related income
FINANCIAL RATIOS
ROE
Overhead ratio
$
$
2Q23
$
841
816 (d)
274
483
1,129 (d)
3,543
13,690 (d)
17,233
1,862 (d)
3,628
4,685
8,313
7,058
1,752
5,306
102
172
274
(d)
38 %
48
$
1Q23
823
676
223
739
$
1,162
3,623
12,833
16,456
$ 10,936 (e) $ 10,041
1,007 (e)
5,290
720
5,695
1,402
3,545
4,520
8,065
6,989
1,746
$ 5,243
75
148
223
40 %
49
$
4Q22
$
834
662
90
694 (f)
1,189 (f)
3,469
12,324
15,793
1,845
QUARTERLY TRENDS
3,339
4,573 (f)
7,912
6,036
1,480 (f)
4,556
43
47
90
$ 9,582 (f) $
584
5,627
$
35 %
50
$
$
3Q22
822
662
313
613
1,302
3,712
10,569
14,281
529
3,345
4,638
7,983
5,769
1,425
4,344
7,960
920
5,401
93
220
313
(f)
(f)
(f)
$
34 % (f)
56
$
(f) $
$
2Q22
855
684
377
621 (f)
(f)
1,313
3,850
8,708
12,558
761
3,237
4,421 (f)
7,658
4,139
1,031
3,108
6,502
1,001
5,055
150
227
377
24 %
61
(f)
(f)
2Q23 Change
1Q23
2%
N
21
23
(35)
(3)
(2)
7
5
33
2
WAN
1
1
9
40
(7)
36
16
23
JPMORGAN CHASE & Co.
2Q22
(2)%
19
(27)
(22)
(14)
(8)
57
37
145
12
6
9
71
70
71
68
1
5
(32)
(24)
(27)
$
$
$
$
2023
SIX MONTHS ENDED JUNE 30,
1,664
$
1,492 (d)
497
1,222
2,291 (d)
7,166
26,523 (d)
33,689
3,264 (d)
7,173
9,205 (d)
16,378
14,047
3,498
10,549
20,977 (e) $
1,727 (e)
10,985
177
320
497
$
39 %
49
$
2022
1,660
1,410
833
1,162 (f)
2,640 (f)
7,705
17,035
24,740
1,439
6,408
8,905 (f)
15,313
7,988
1,972 (f)
6,016
12,517 (f)
2,170
10,053
361
472
833
23 %
62
2023 Change
2022
6
(40)
5
(13)
(7)
56
36
127
12
%
3
7
76 77 75
68
(20)
9
(51)
(32)
(40)
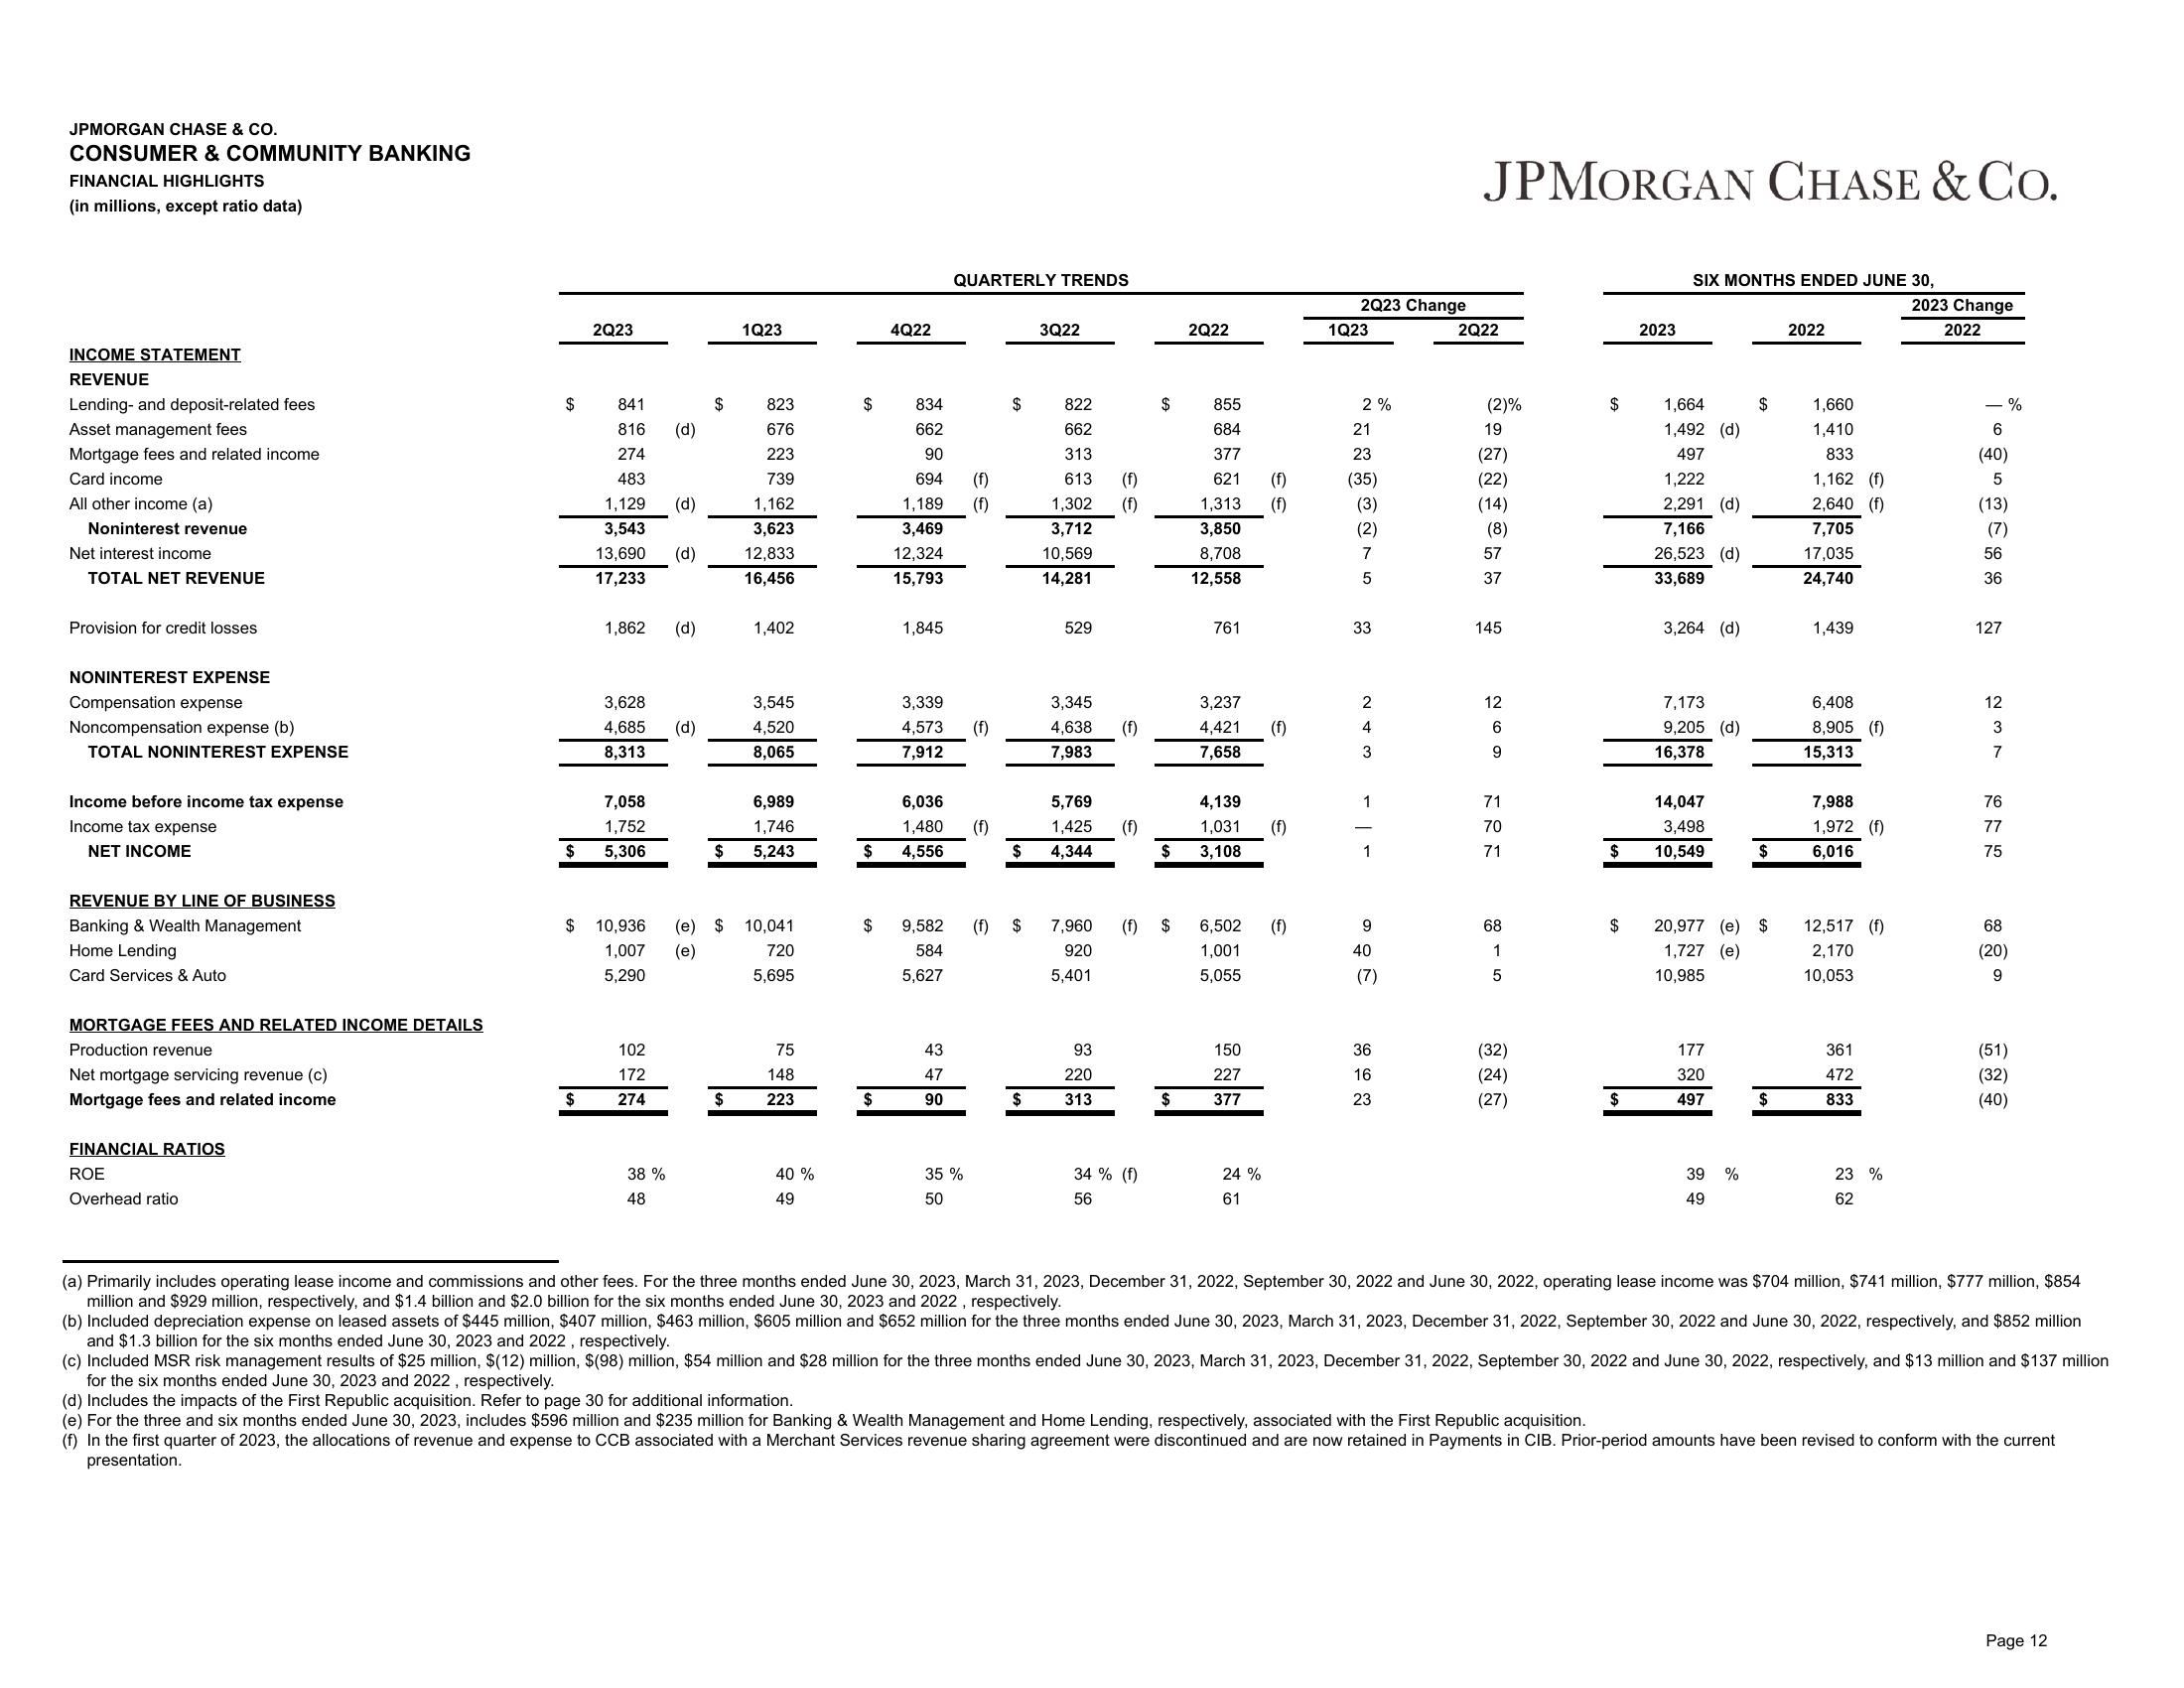
(a) Primarily includes operating lease income and commissions and other fees. For the three months ended June 30, 2023, March 31, 2023, December 31, 2022, September 30, 2022 and June 30, 2022, operating lease income was $704 million, $741 million, $777 million, $854
million and $929 million, respectively, and $1.4 billion and $2.0 billion for the six months ended June 30, 2023 and 2022, respectively.
(b) Included depreciation expense on leased assets of $445 million, $407 million, $463 million, $605 million and $652 million for the three months ended June 30, 2023, March 31, 2023, December 31, 2022, September 30, 2022 and June 30, 2022, respectively, and $852 million
and $1.3 billion for the six months ended June 30, 2023 and 2022, respectively.
(c) Included MSR risk management results of $25 million, $(12) million, $(98) million, $54 million and $28 million for the three months ended June 30, 2023, March 31, 2023, December 31, 2022, September 30, 2022 and June 30, 2022, respectively, and $13 million and $137 million
for the six months ended June 30, 2023 and 2022, respectively.
(d) Includes the impacts of the First Republic acquisition. Refer to page 30 for additional information.
(e) For the three and six months ended June 30, 2023, includes $596 million and $235 million for Banking & Wealth Management and Home Lending, respectively, associated with the First Republic acquisition.
(f) In the first quarter of 2023, the allocations of revenue and expense to CCB associated with a Merchant Services revenue sharing agreement were discontinued and are now retained in Payments in CIB. Prior-period amounts have been revised to conform with the current
presentation.
Page 12View entire presentation