Berkeley Lights IPO Presentation Deck
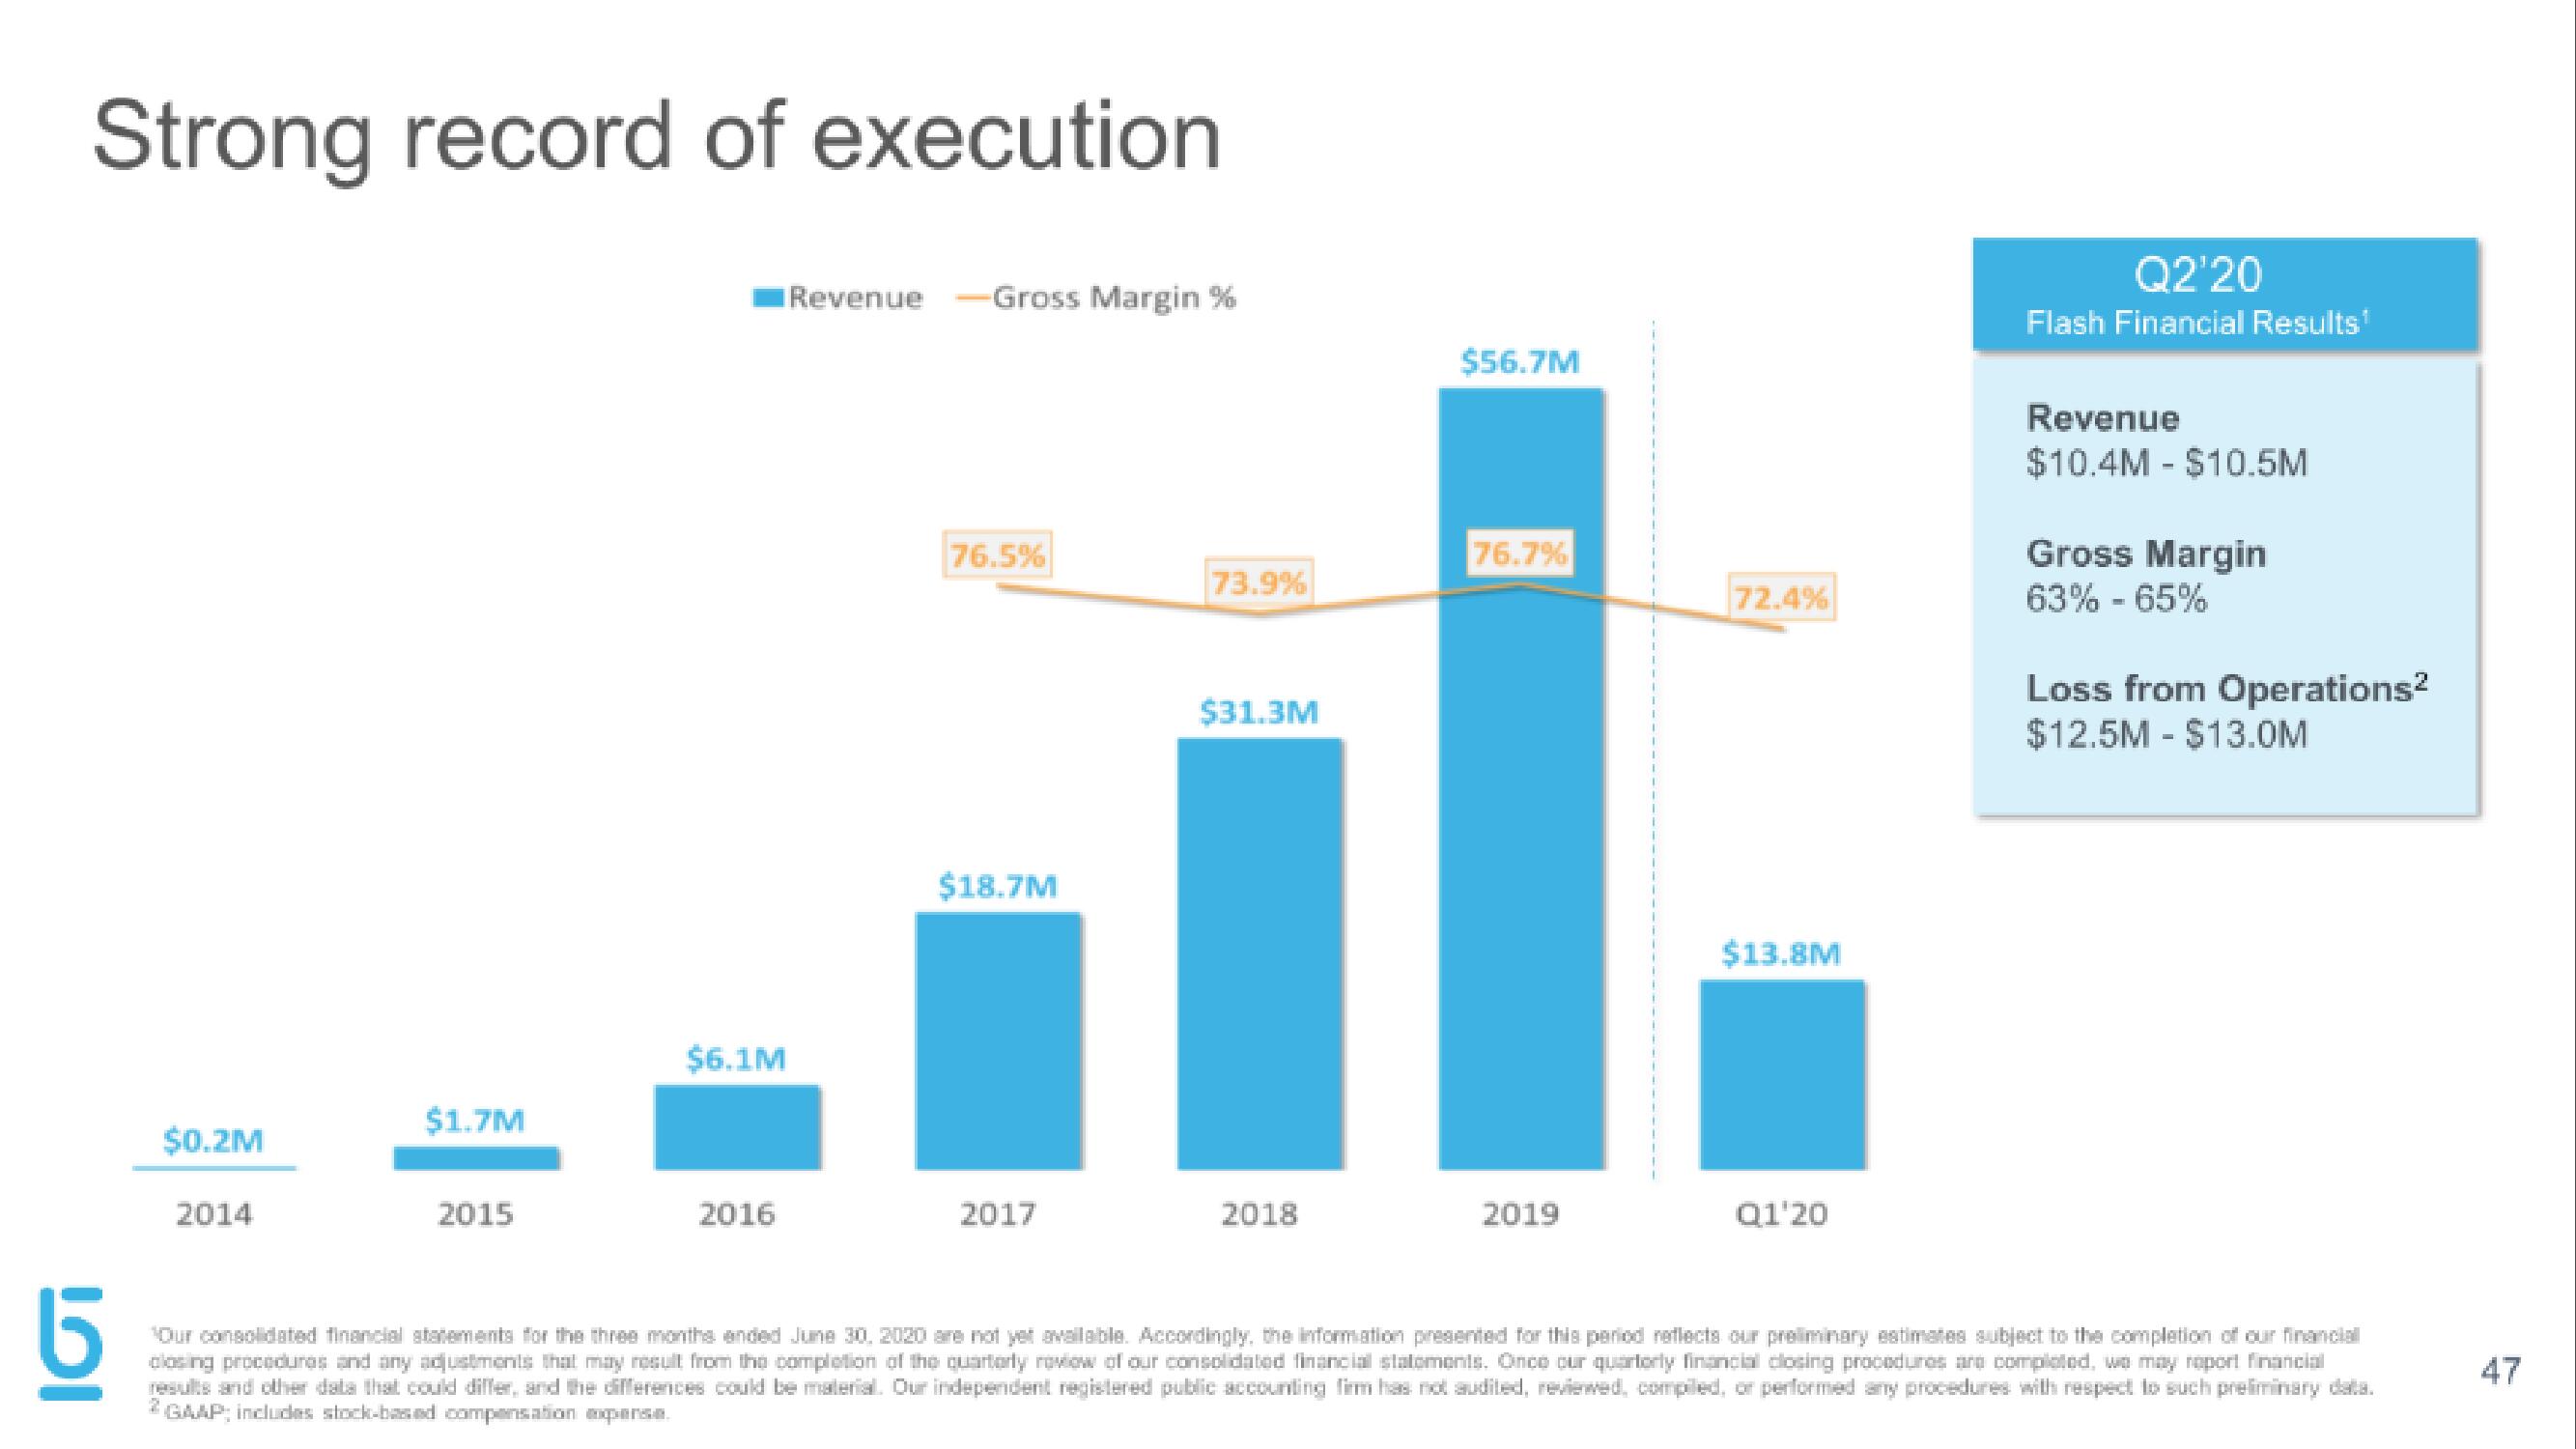
Strong record of execution
IGT
6
$0.2M
2014
$1.7M
2015
$6.1M
2016
Revenue
-Gross Margin %
76.5%
$18.7M
2017
73.9%
$31.3M
2018
$56.7M
76.7%
2019
72.4%
$13.8M
Q1'20
Q2'20
Flash Financial Results¹
Revenue
$10.4M - $10.5M
Gross Margin
63% - 65%
Loss from Operations²
$12.5M - $13.0M
Our consolidated financial statements for the three months ended June 30, 2020 are not yet available. Accordingly, the information presented for this period reflects our preliminary estimates subject to the completion of our financial
closing procedures and any adjustments that may result from the completion of the quarterly review of our consolidated financial statements. Once our quarterly financial closing procedures and completed, wo may roport financial
results and other data that could differ, and the differences could be material. Our independent registered public accounting firm has not audited, reviewed, compiled, or performed any procedures with respect to such preliminary data.
2 GAAP: includes stock-based compensation expense.
47View entire presentation