KKR Real Estate Finance Trust Investor Presentation Deck
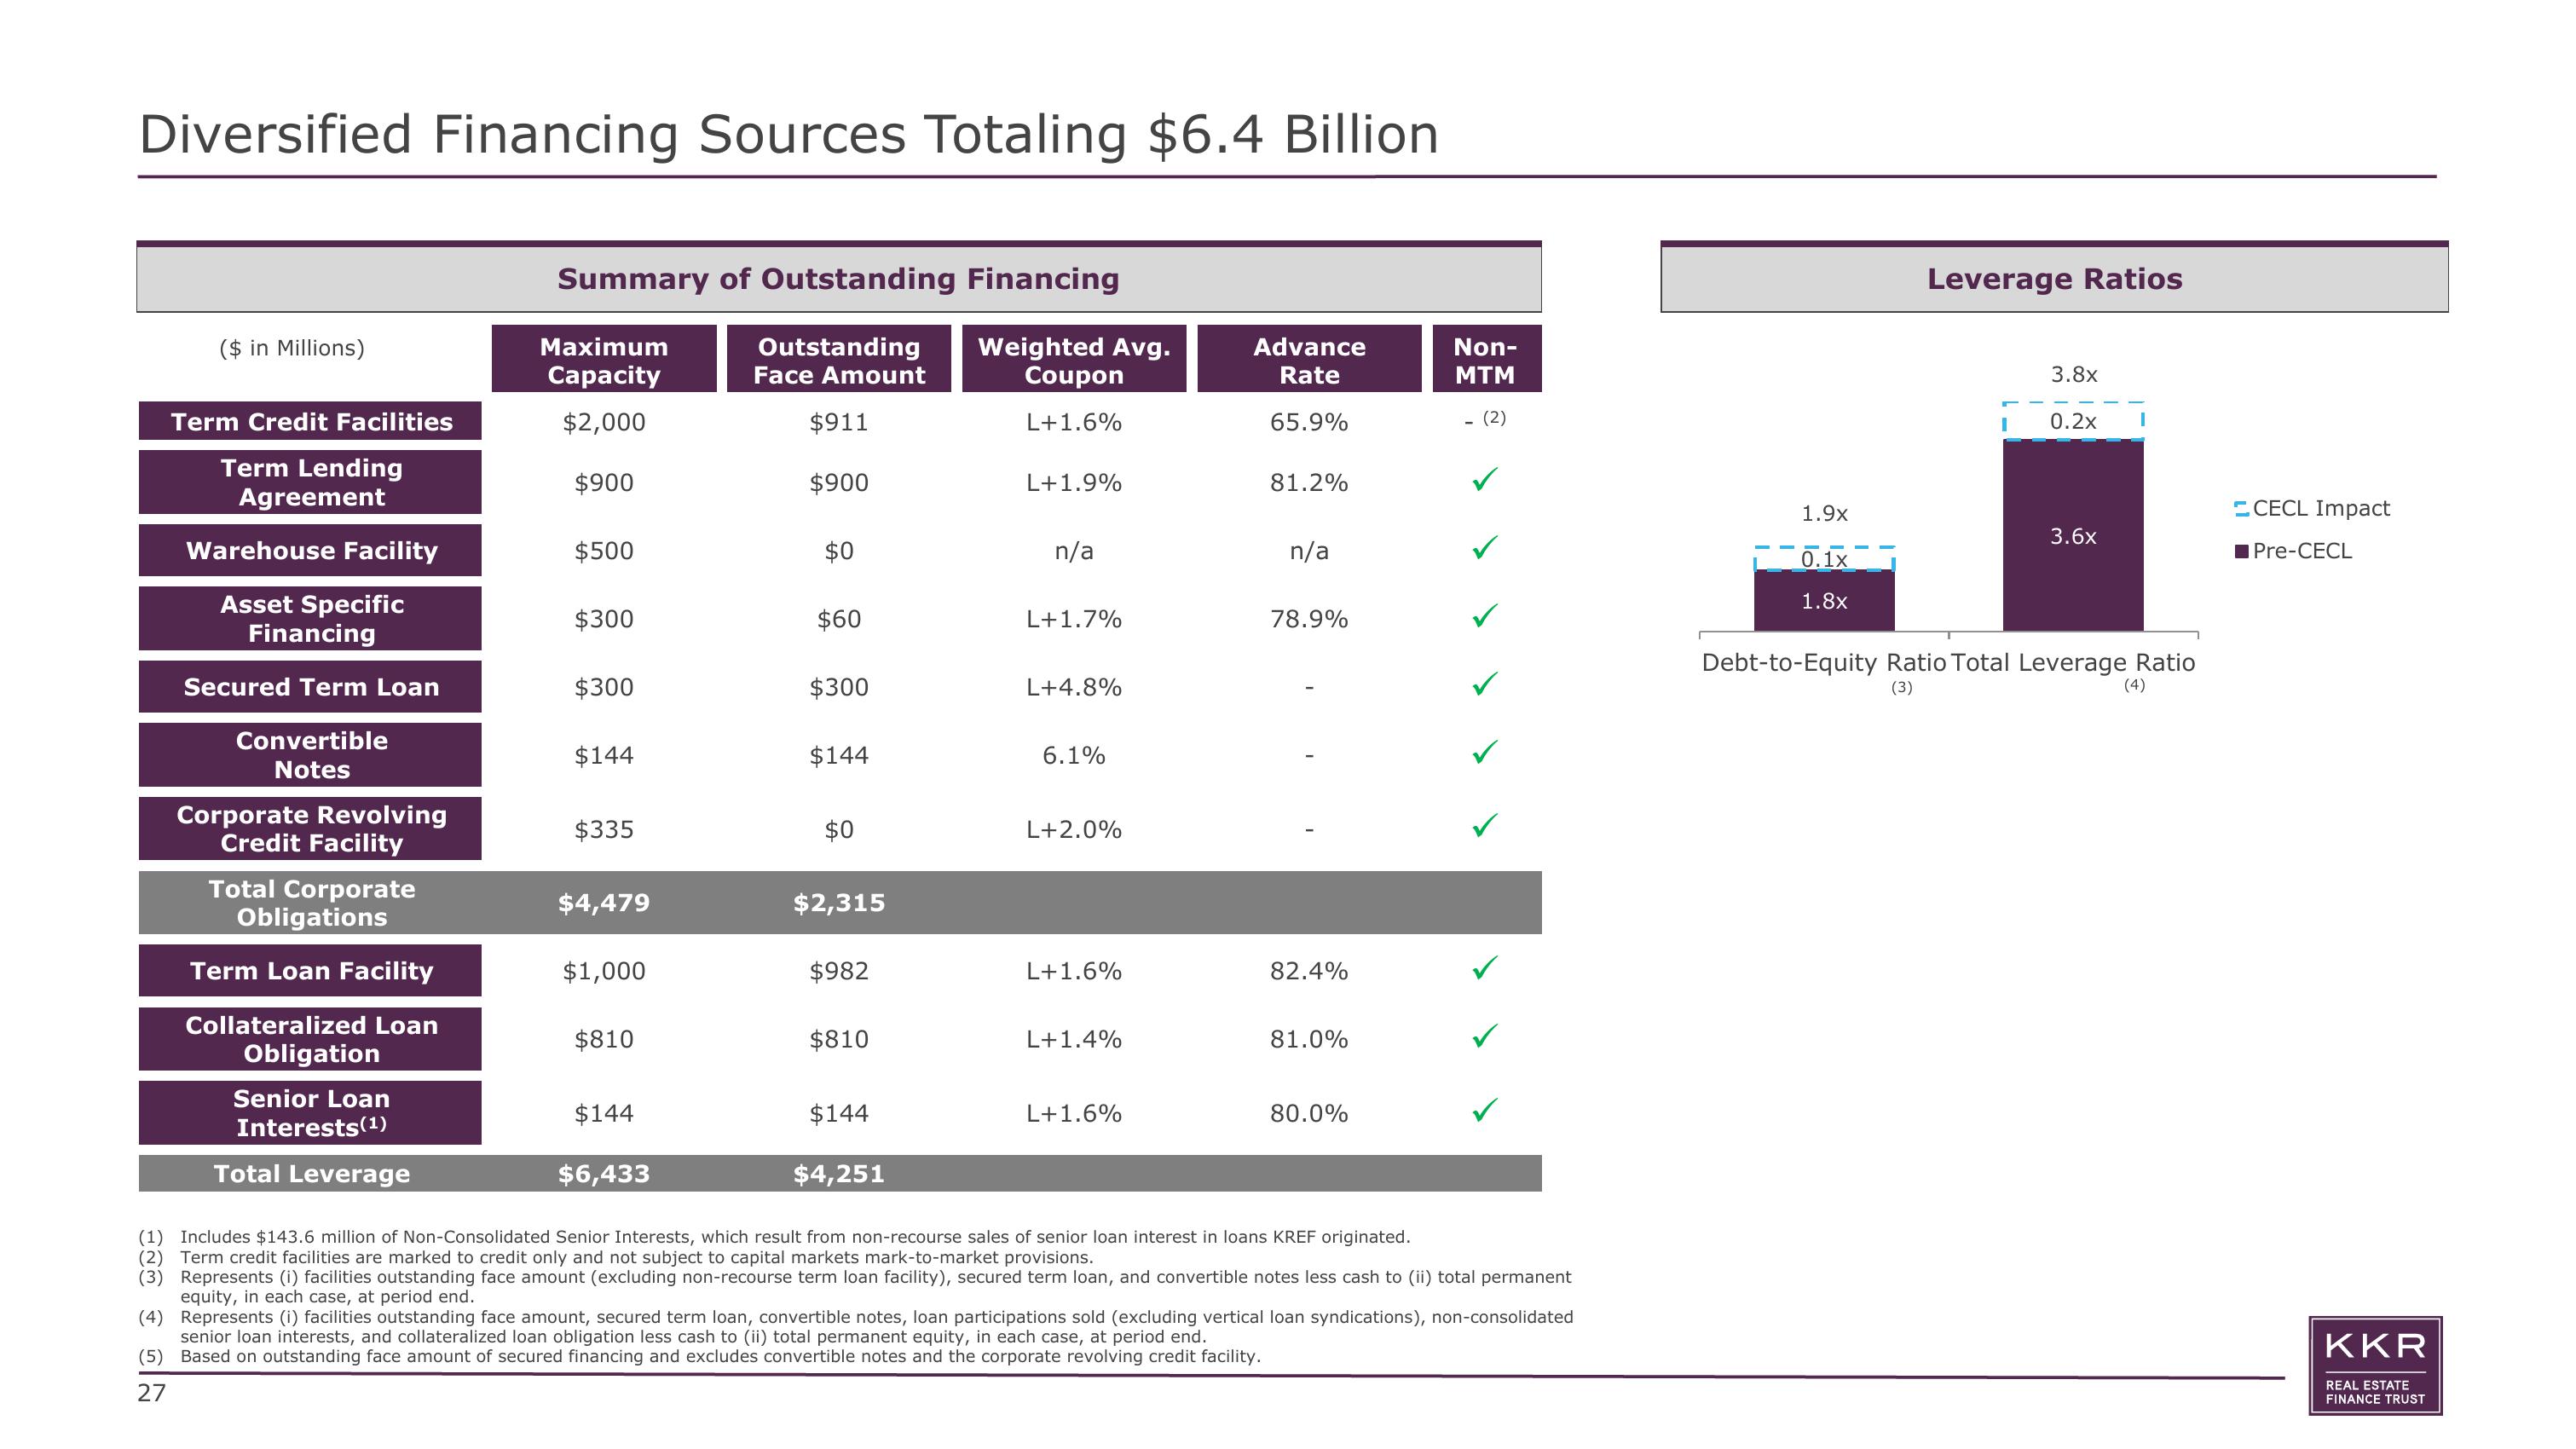
Diversified Financing Sources Totaling $6.4 Billion
($ in Millions)
Term Credit Facilities
Term Lending
Agreement
Warehouse Facility
Asset Specific
Financing
Secured Term Loan
Convertible
Notes
Corporate Revolving
Credit Facility
Total Corporate
Obligations
Term Loan Facility
Collateralized Loan
Obligation
Senior Loan
Interests (1)
Total Leverage
Summary of Outstanding Financing
Outstanding
Face Amount
Weighted Avg.
Coupon
$911
L+1.6%
$900
Maximum
Capacity
$2,000
$900
$500
$300
$300
$144
$335
$4,479
$1,000
$810
$144
$6,433
$0
$60
$300
$144
$0
$2,315
$982
$810
$144
$4,251
L+1.9%
n/a
L+1.7%
L+4.8%
6.1%
L+2.0%
L+1.6%
L+1.4%
L+1.6%
Advance
Rate
65.9%
81.2%
n/a
78.9%
82.4%
81.0%
80.0%
Non-
MTM
(2)
(1) Includes $143.6 million of Non-Consolidated Senior Interests, which result from non-recourse sales of senior loan interest in loans KREF originated.
(2) Term credit facilities are marked to credit only and not subject to capital markets mark-to-market provisions.
(3) Represents (i) facilities outstanding face amount (excluding non-recourse term loan facility), secured term loan, and convertible notes less cash to (ii) total permanent
equity, in each case, at period end.
(4) Represents (i) facilities outstanding face amount, secured term loan, convertible notes, loan participations sold (excluding vertical loan syndications), non-consolidated
senior loan interests, and collateralized loan obligation less cash to (ii) total permanent equity, in each case, at period end.
(5) Based on outstanding face amount of secured financing and excludes convertible notes and the corporate revolving credit facility.
27
1.9x
0.1x
1.8x
Leverage Ratios
3.8x
I 0.2x
3.6x
I
Debt-to-Equity Ratio Total Leverage Ratio
(3)
(4)
CECL Impact
Pre-CECL
KKR
REAL ESTATE
FINANCE TRUSTView entire presentation