UBS Results Presentation Deck
Investment Bank
Profit before tax
m
Operating
income
m
Cost/income ratio
Global
Banking
Global
Markets
529
2,011
669
1,433
(91)
71%
4Q20
UBS 1 Includes UK bank levy expenses of 31m in 4Q21
412
2,273
788
1,483
2
+35%
668
82%
1Q21
+11%
2,470
881
1,567
Credit loss (expenses)/releases
21
74%
2Q21
837
2,510
792
1,723
(5)
67%
3Q21
713
2,235
696
1,523
16
69%
4Q21
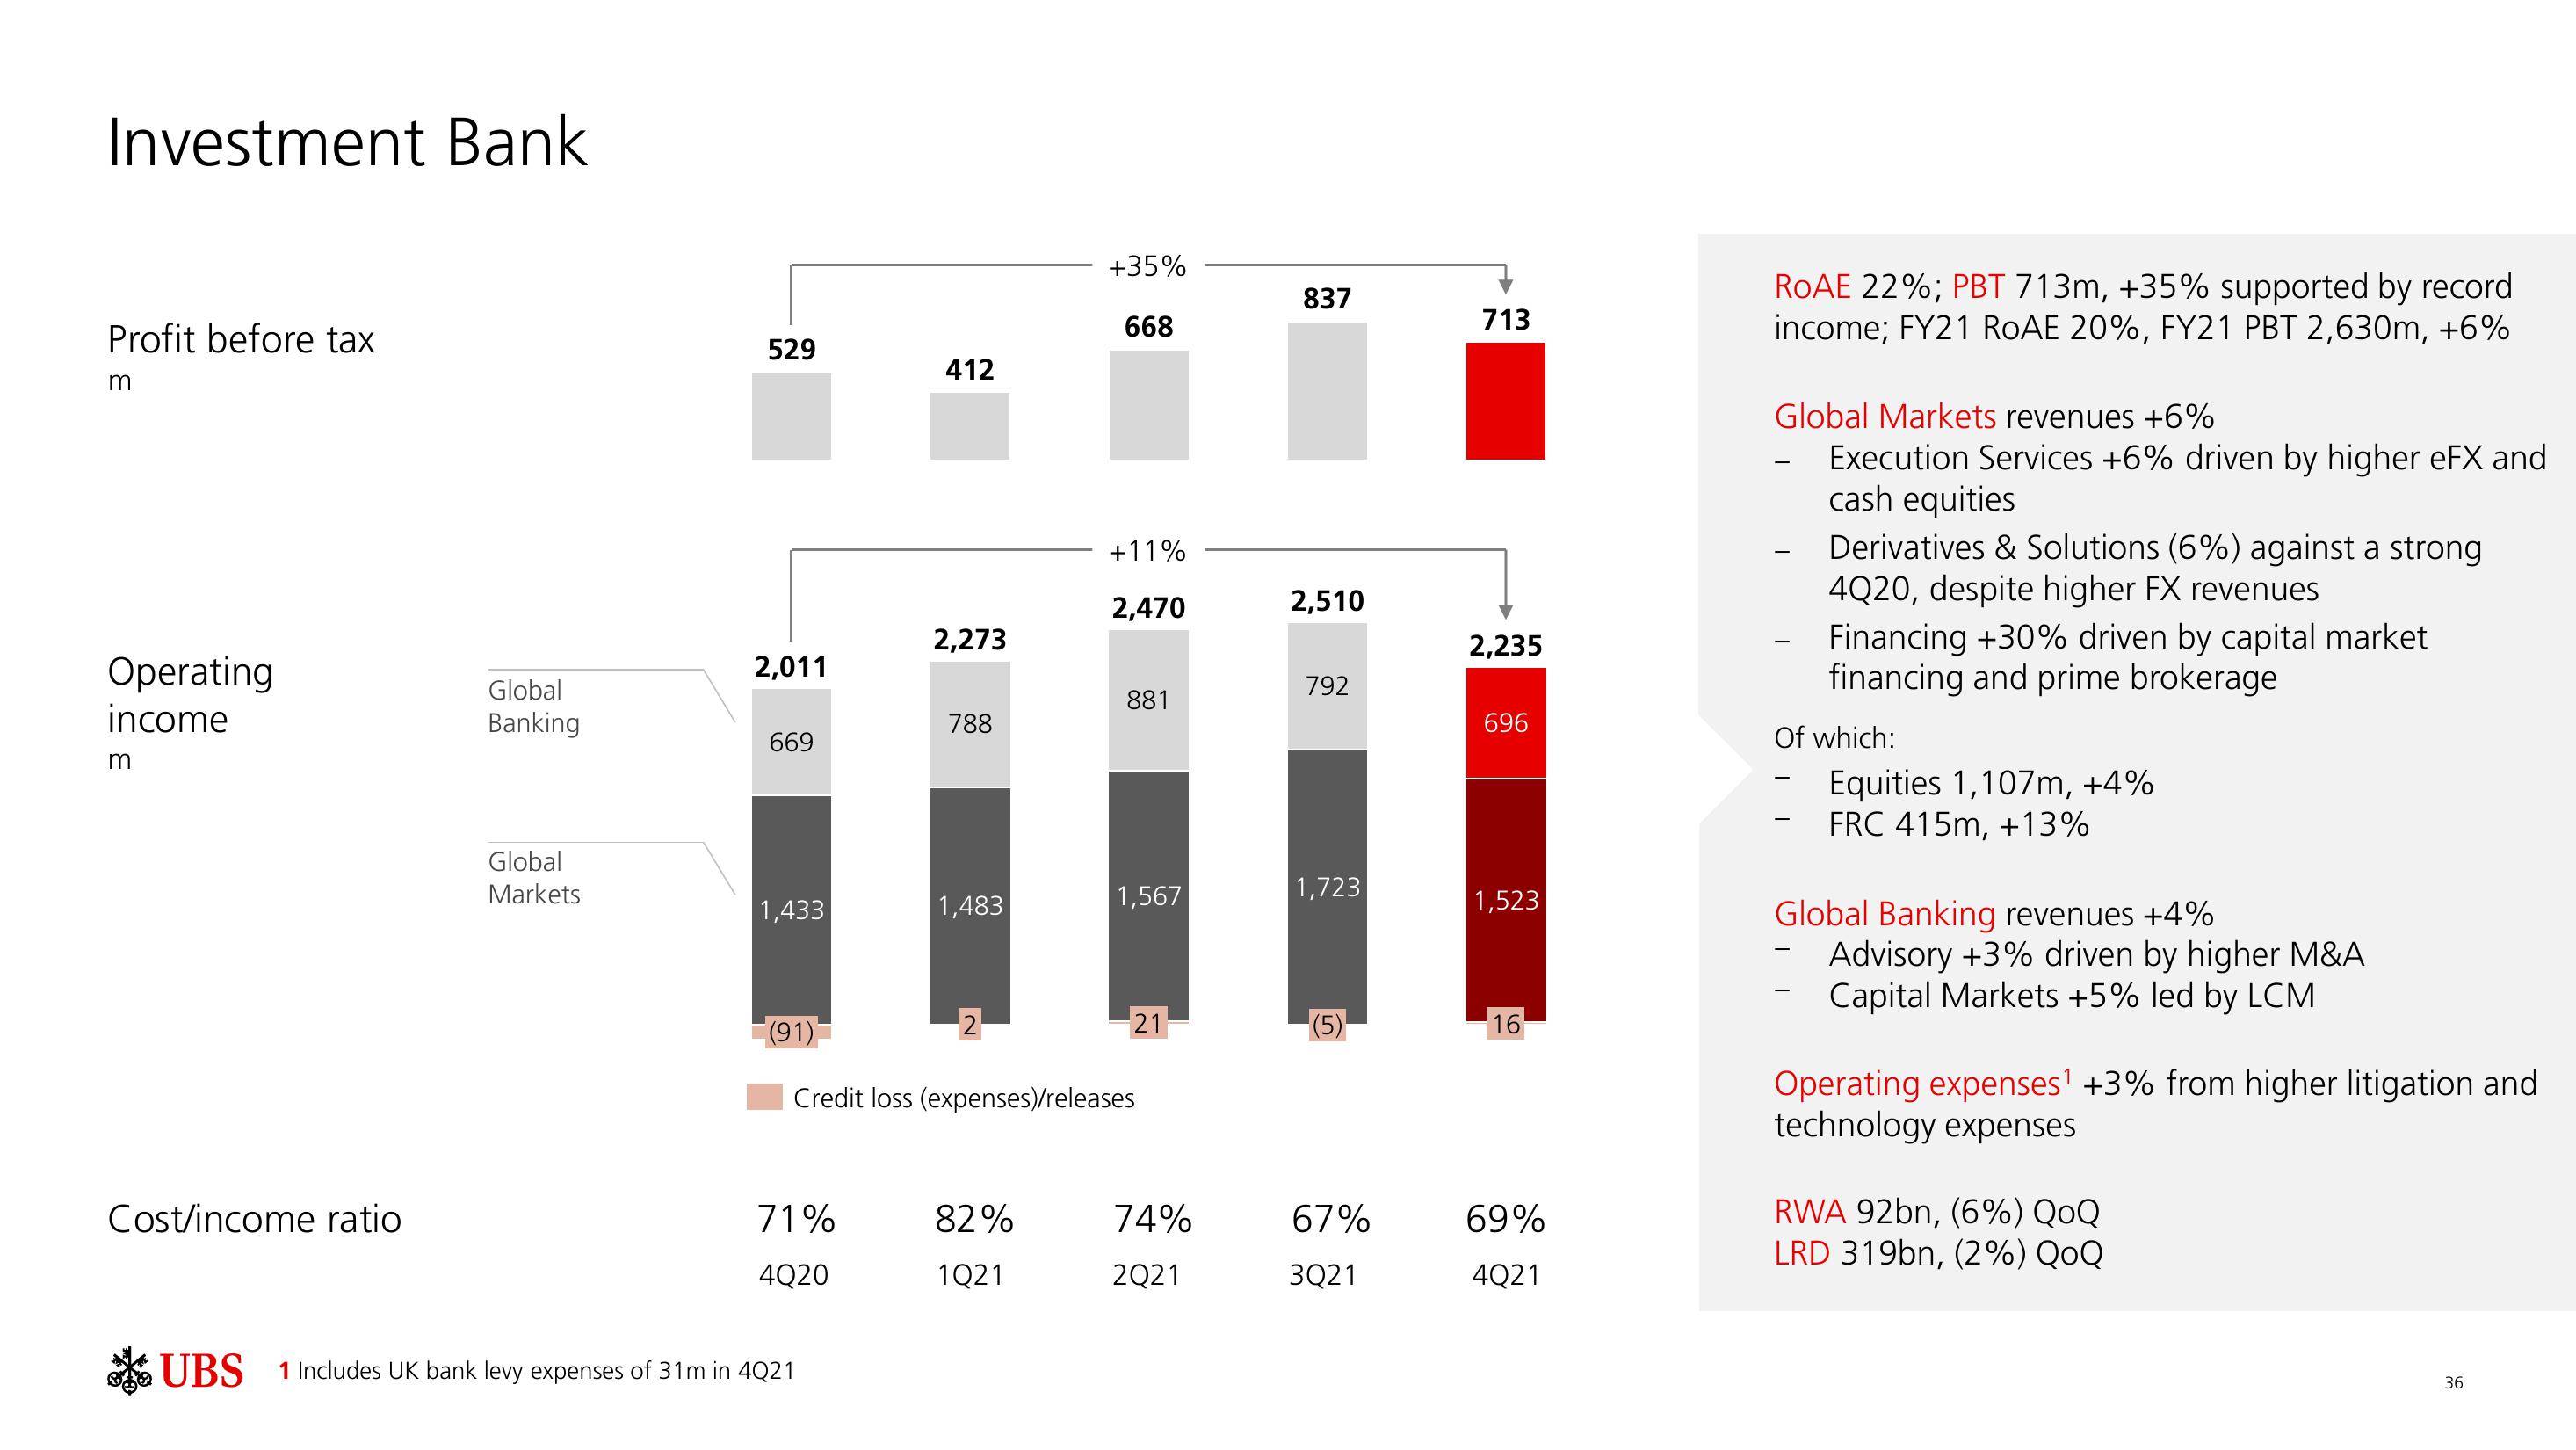
ROAE 22%; PBT 713m, +35% supported by record
income; FY21 ROAE 20%, FY21 PBT 2,630m, +6%
Global Markets revenues +6%
Execution Services +6% driven by higher eFX and
cash equities
-
-
Derivatives & Solutions (6%) against a strong
4Q20, despite higher FX revenues
Of which:
Financing +30% driven by capital market
financing and prime brokerage
-
Equities 1,107m, +4%
FRC 415m, +13%
Global Banking revenues +4%
Advisory +3% driven by higher M&A
Capital Markets +5% led by LCM
Operating expenses¹ +3% from higher litigation and
technology expenses
RWA 92bn, (6%) QoQ
LRD 319bn, (2%) QoQ
36View entire presentation