Wix Results Presentation Deck
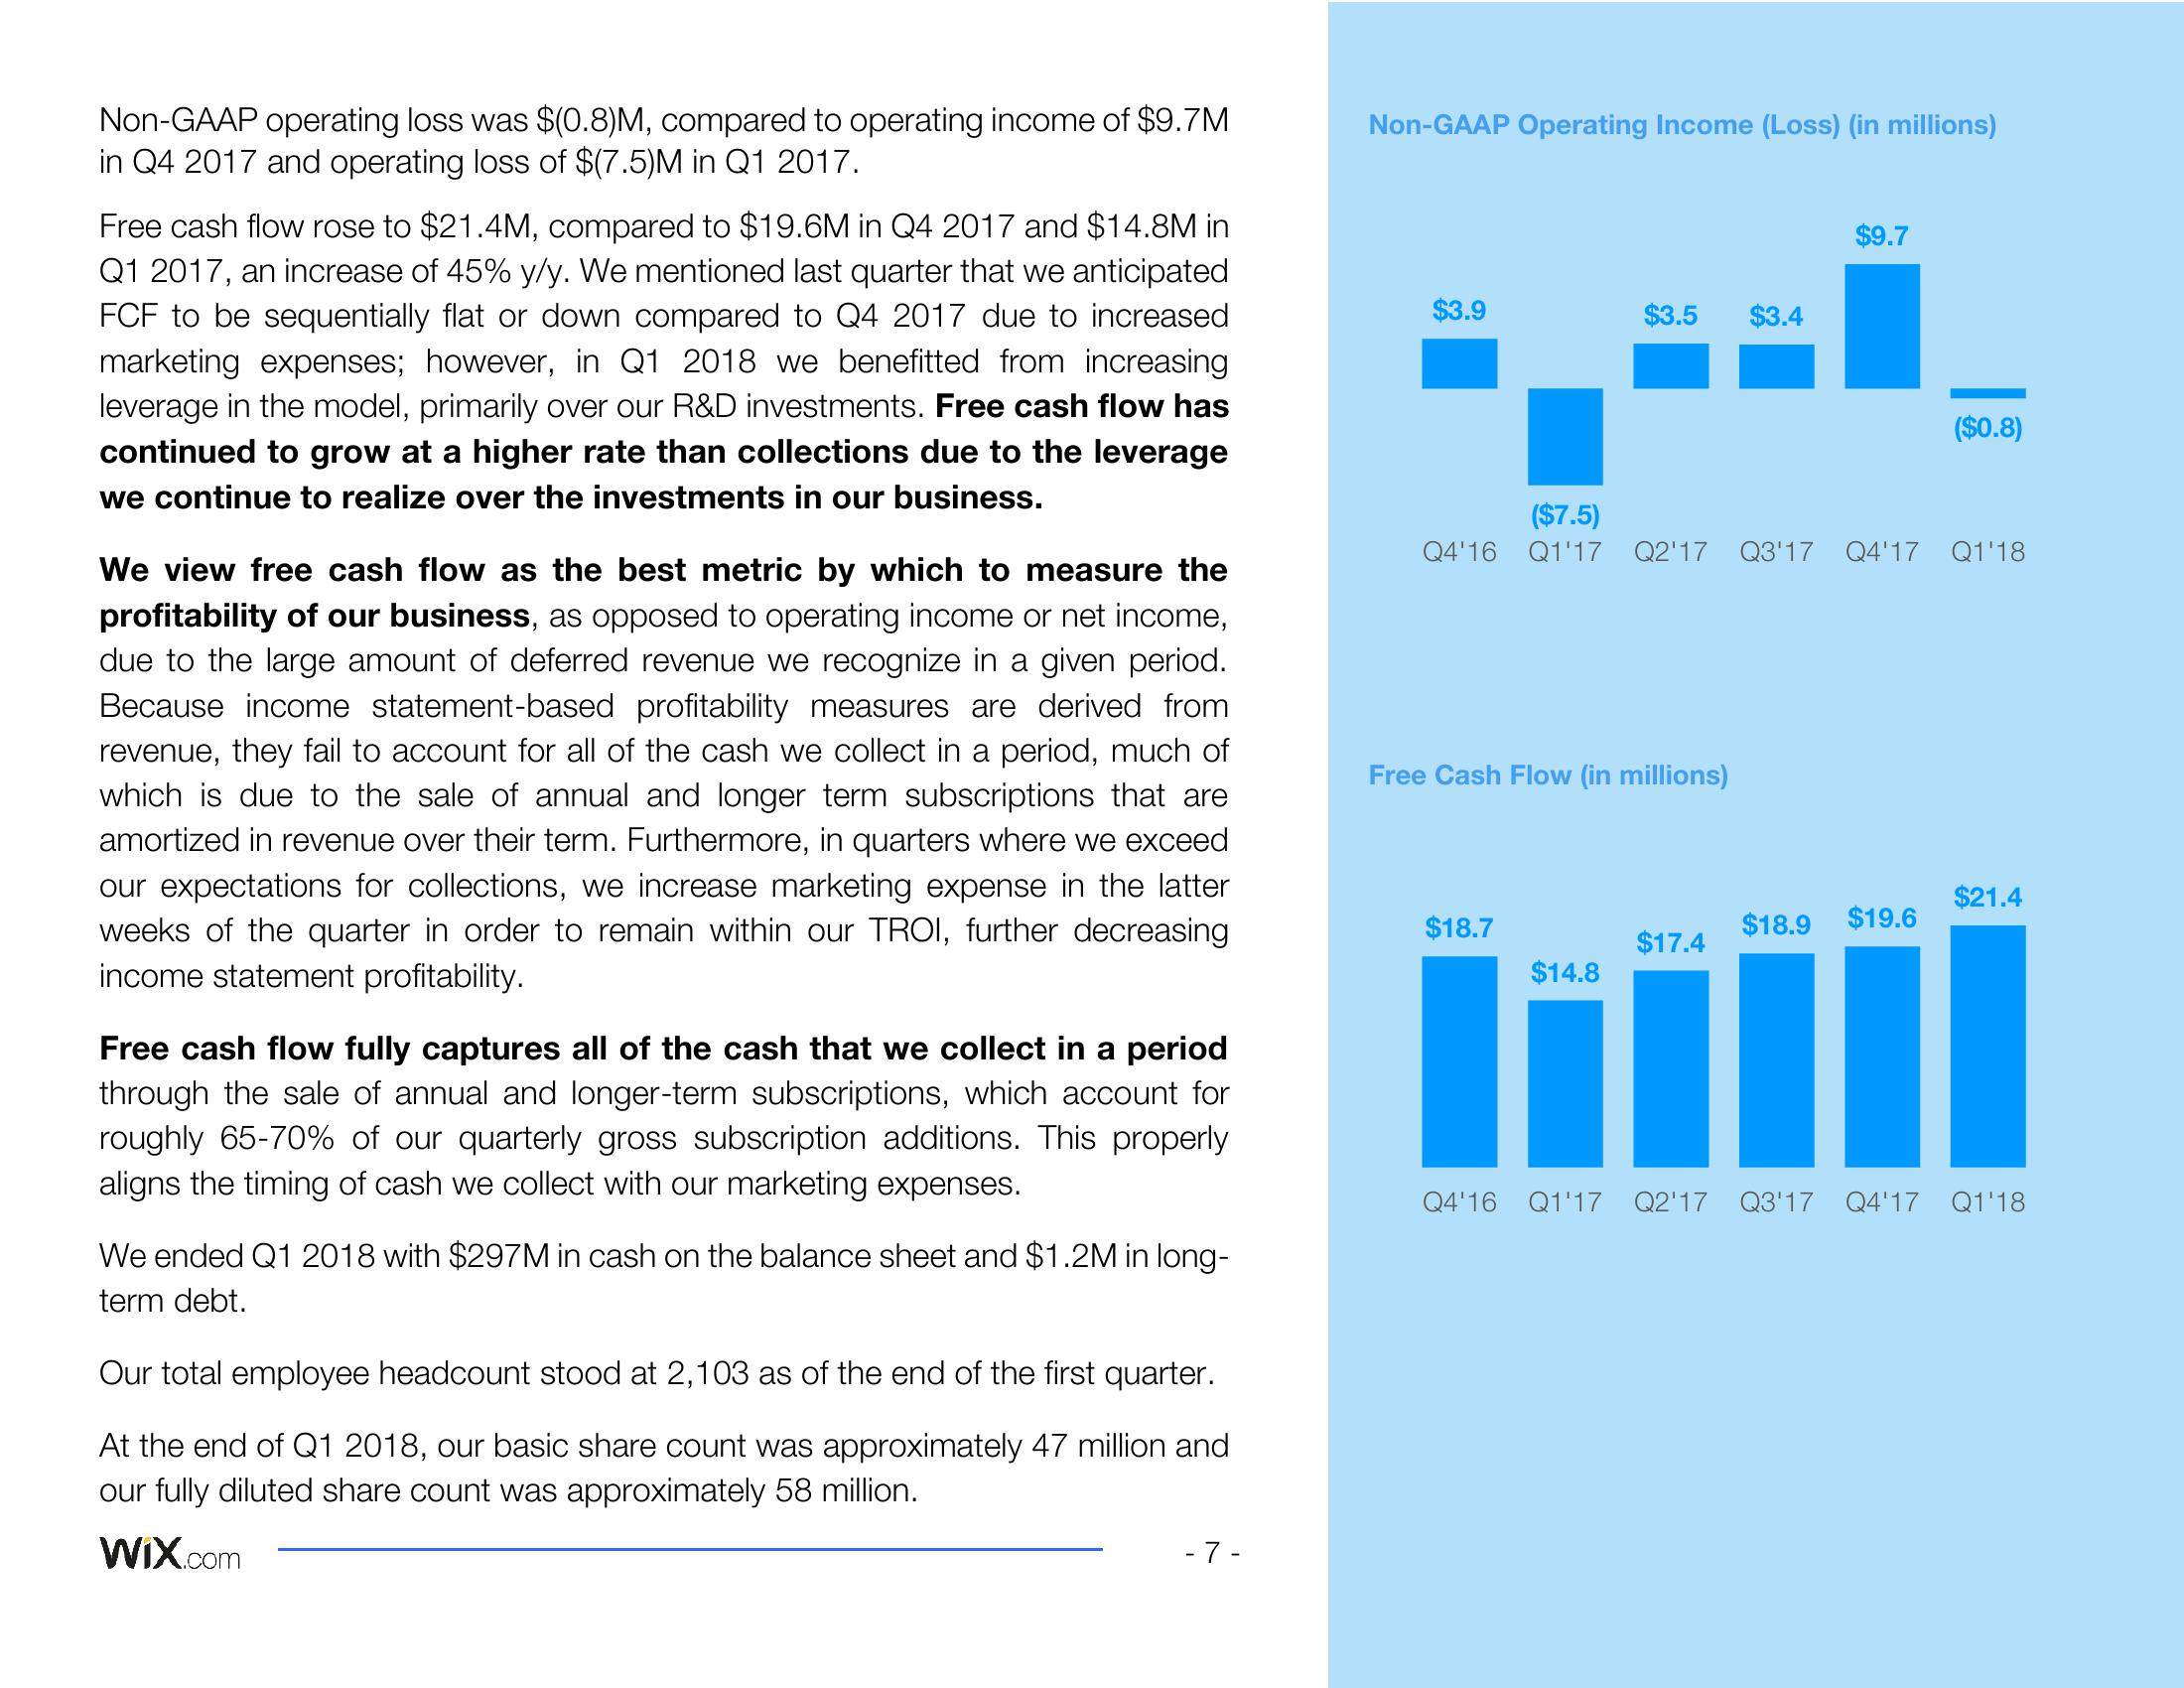
Non-GAAP operating loss was $(0.8)M, compared to operating income of $9.7M
in Q4 2017 and operating loss of $(7.5)M in Q1 2017.
Free cash flow rose to $21.4M, compared to $19.6M in Q4 2017 and $14.8M in
Q1 2017, an increase of 45% y/y. We mentioned last quarter that we anticipated
FCF to be sequentially flat or down compared to Q4 2017 due to increased
marketing expenses; however, in Q1 2018 we benefitted from increasing
leverage in the model, primarily over our R&D investments. Free cash flow has
continued to grow at a higher rate than collections due to the leverage
we continue to realize over the investments in our business.
We view free cash flow as the best metric by which to measure the
profitability of our business, as opposed to operating income or net income,
due to the large amount of deferred revenue we recognize in a given period.
Because income statement-based profitability measures are derived from
revenue, they fail to account for all of the cash we collect in a period, much of
which is due to the sale of annual and longer term subscriptions that are
amortized in revenue over their term. Furthermore, in quarters where we exceed
our expectations for collections, we increase marketing expense in the latter
weeks of the quarter in order to remain within our TROI, further decreasing
income statement profitability.
Free cash flow fully captures all of the cash that we collect in a period
through the sale of annual and longer-term subscriptions, which account for
roughly 65-70% of our quarterly gross subscription additions. This properly
aligns the timing of cash we collect with our marketing expenses.
We ended Q1 2018 with $297M in cash on the balance sheet and $1.2M in long-
term debt.
Our total employee headcount stood at 2,103 as of the end of the first quarter.
At the end of Q1 2018, our basic share count was approximately 47 million and
our fully diluted share count was approximately 58 million.
Wix.com
-7-
Non-GAAP Operating Income (Loss) (in millions)
$3.9
$3.5
Free Cash Flow (in millions)
$18.7
($7.5)
Q4'16 Q1'17 Q2'17 Q3'17 Q4'17 Q1'18
$14.8
$3.4
$9.7
$17.4
($0.8)
$18.9
$19.6
III
Q4'16 Q1'17 Q2'17 Q3'17 Q4'17 Q1'18
$21.4View entire presentation