Rally SPAC Presentation Deck
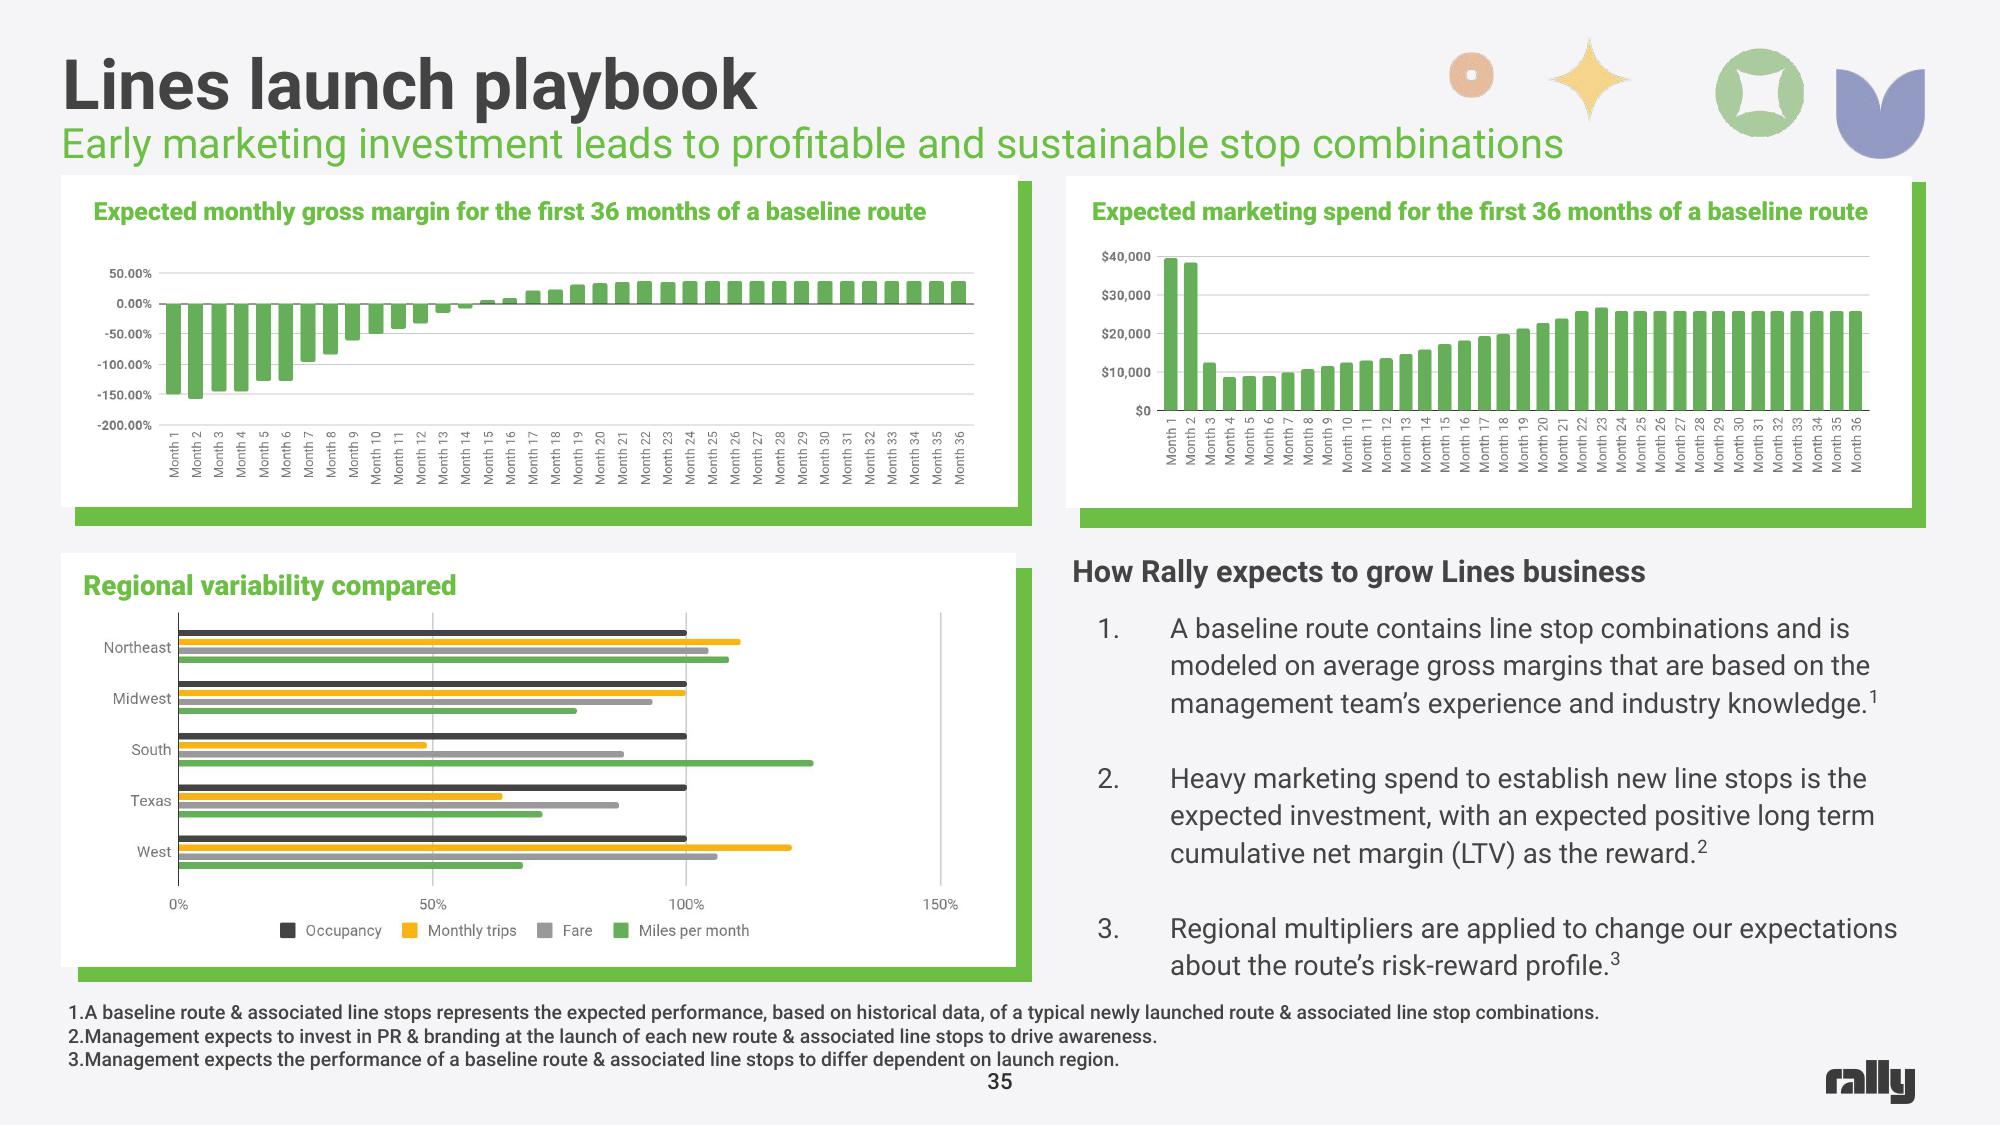
Lines launch playbook
Early marketing investment leads to profitable and sustainable stop combinations
Expected monthly gross margin for the first 36 months of a baseline route
50.00%
0.00%
-50.00%
-100.00%
-150.00%
-200.00%
Month
Month 2
Month 3
Month 4
Regional variability compared
Northeast
Midwest
South
Texas
West
Month 5
Month 6
Month 7
Month 8
Month 9
Month 10
Month 11
Month 12
Month 13
Month 14
Month 15
Month 16
Month 17
Month 18
Month 19
Month 20
Month 21
Month 22
Month 23
Month 24
Month 25
Month 26
Month 27
Month 28
Month 29
Month 30
Month 31
Month 32
Month 33
0%
50%
Occupancy Monthly trips Fare
100%
Miles per month
Month 34
Month 35
Month 36
150%
Expected marketing spend for the first 36 months of a baseline route
$40,000
$30,000
$20,000
$10,000
2.
$0
3.
|
Month 1
Month 2
Month 3
Month 4
Month 5
w
Month 6
Month 7
Month 8
Month 9
Month 10
Month 11
Month 12
Month 13
Month 14
Month 15
Month 16
Month 17
Month 18
Month 19
Month 20
Month 21
Month 22
Month 23
How Rally expects to grow Lines business
1.
28
Month 24
Month 25
Month 26
Month 27
Month
Month 29
Month 30
Month 31
Month 32
Month 33
Month 34
Month 35
Month 36
and is
A baseline route contains line stop combinations
modeled on average gross margins that are based on the
management team's experience and industry knowledge.¹
Heavy marketing spend to establish new line stops is the
expected investment, with an expected positive long term
cumulative net margin (LTV) as the reward.²
Regional multipliers are applied to change our expectations
about the route's risk-reward profile.³
1.A baseline route & associated line stops represents the expected performance, based on historical data, of a typical newly launched route & associated line stop combinations.
2.Management expects to invest in PR & branding at the launch of each new route & associated line stops to drive awareness.
3.Management expects the performance of a baseline route & associated line stops to differ dependent on launch region.
35
rallyView entire presentation