First Foundation Investor Presentation Deck
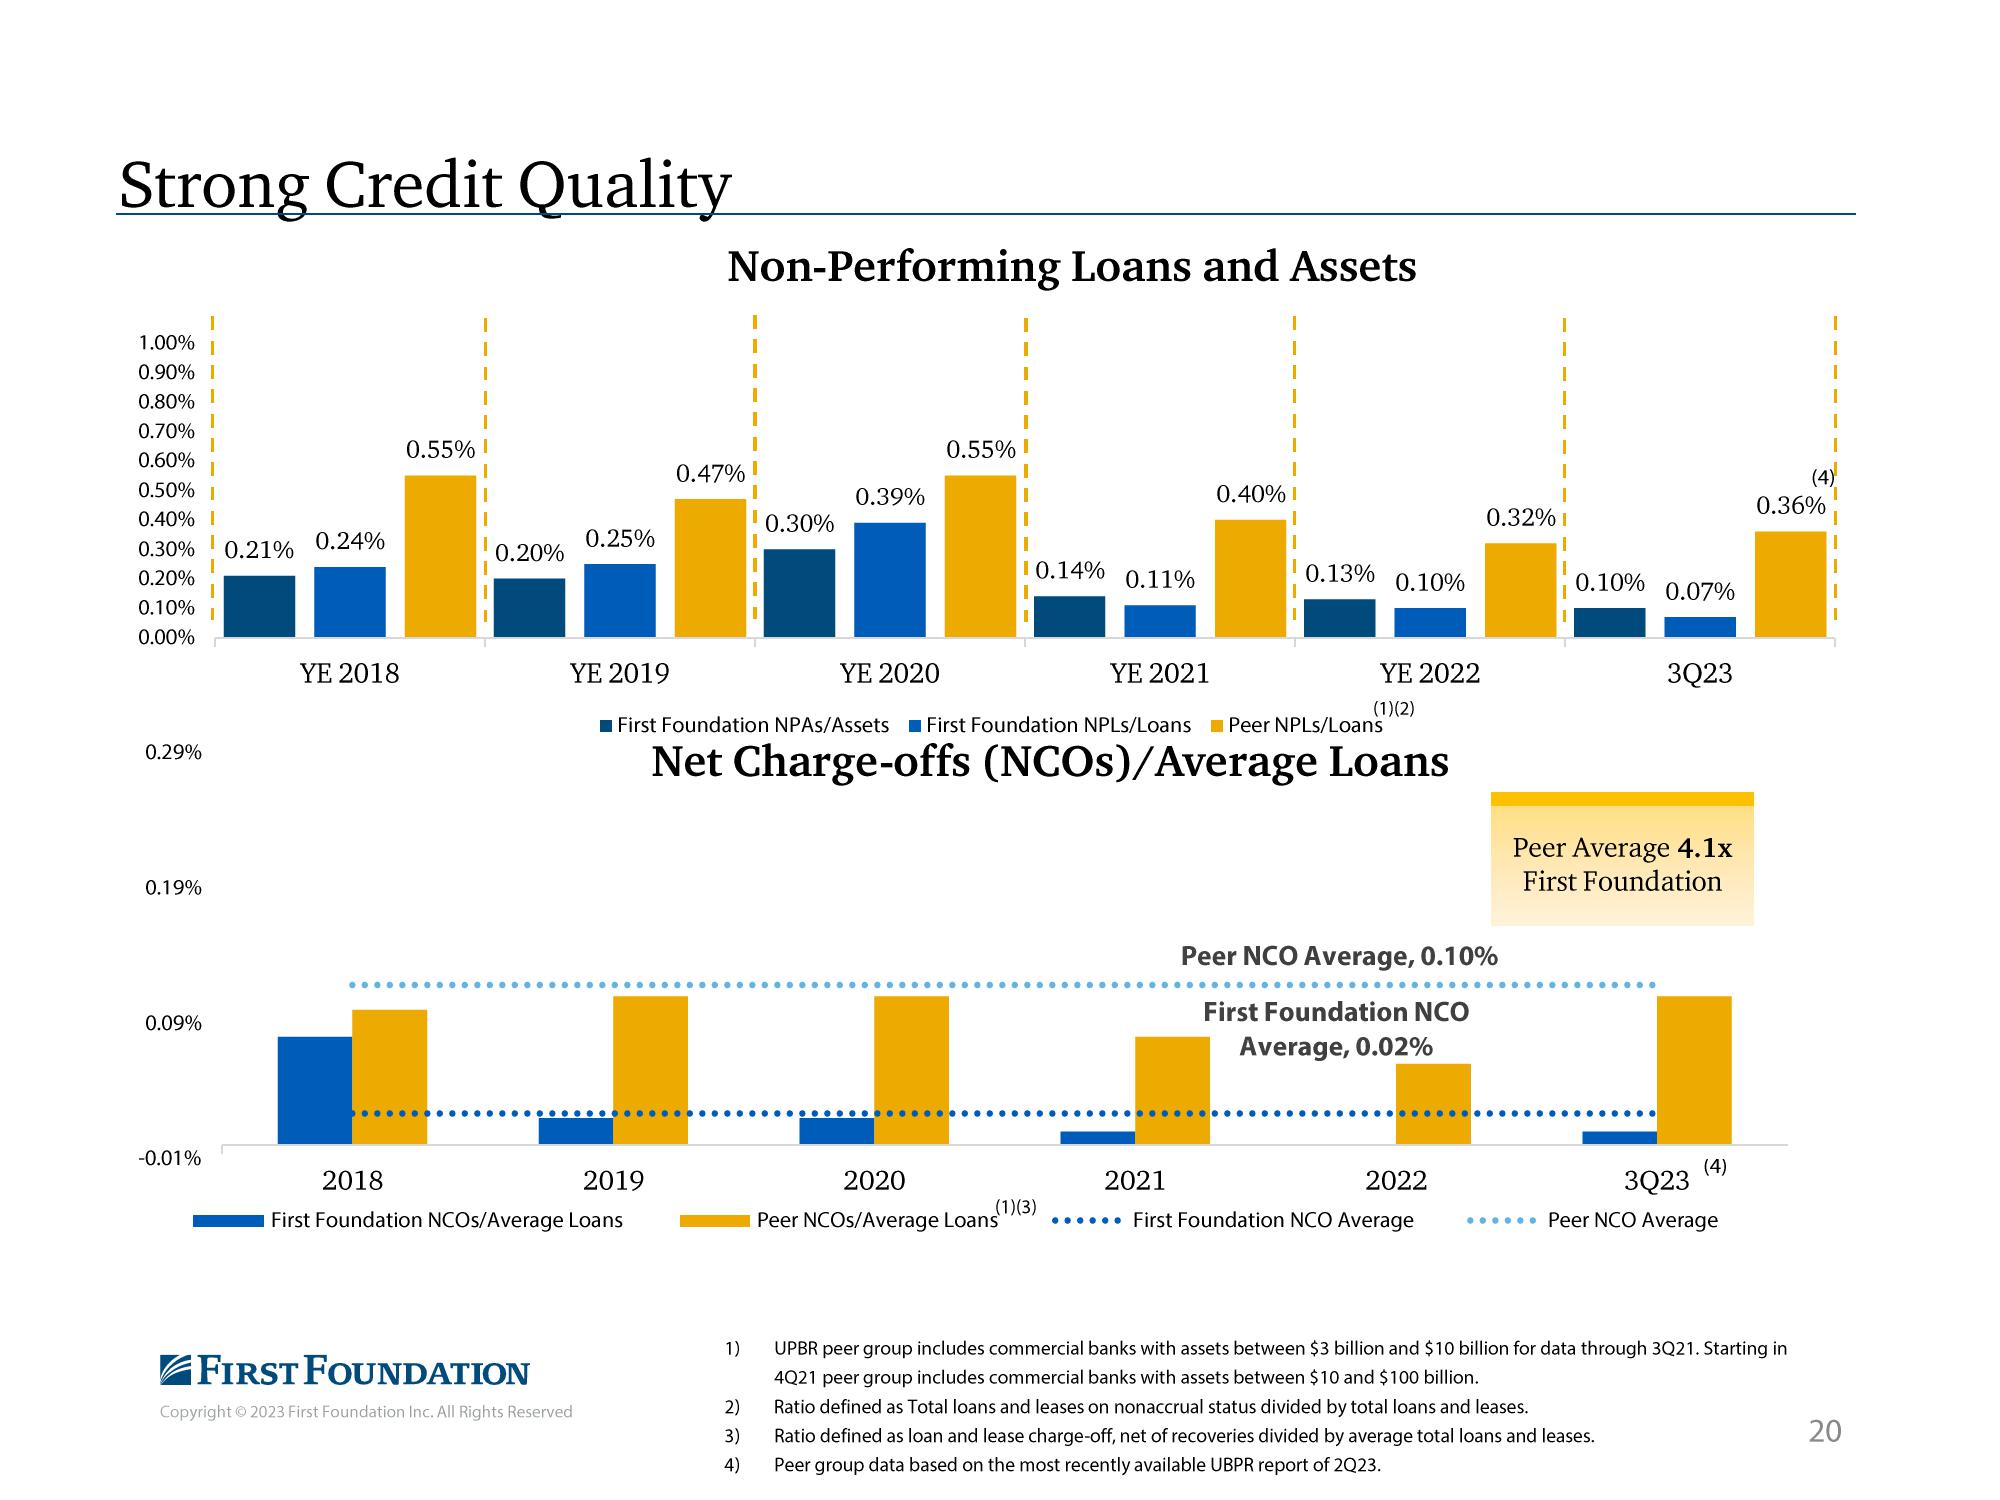
Strong Credit Quality
1.00%
0.90% I
0.80% 1
0.70%
0.60%
0.50% I
0.40% I
0.30% 0.21%
0.20%
0.10%
0.00%
0.29%
0.19%
0.09%
-0.01%
0.24%
YE 2018
0.55% !
..........
0.20%
0.25%
2018
2019
First Foundation NCOS/Average Loans
FIRST FOUNDATION
Copyright © 2023 First Foundation Inc. All Rights Reserved
Non-Performing Loans and Assets
0.47%
1)
0.30%
2)
3)
4)
0.39%
YE 2020
0.55% !
......
10.14%
YE 2019
■First Foundation NPAS/Assets First Foundation NPLs/Loans Peer NPLs/Loans
Net Charge-offs (NCOs)/Average Loans
2020
Peer NCOS/Average Loans
0.11%
(1)(3)
YE 2021
0.40% I
0.13%
0.10%
YE 2022
(1)(2)
0.32% I
Peer NCO Average, 0.10%
...............
First Foundation NCO
Average, 0.02%
2021
2022
...... First Foundation NCO Average
0.10% 0.07%
Peer Average 4.1x
First Foundation
.........
3Q23
....
(4)
3Q23
...... Peer NCO Average
(4)
0.36%
UPBR peer group includes commercial banks with assets between $3 billion and $10 billion for data through 3Q21. Starting in
4Q21 peer group includes commercial banks with assets between $10 and $100 billion.
Ratio defined as Total loans and leases on nonaccrual status divided by total loans and leases.
Ratio defined as loan and lease charge-off, net of recoveries divided by average total loans and leases.
Peer group data based on the most recently available UBPR report of 2Q23.
20View entire presentation