Main Street Capital Investor Day Presentation Deck
Dividend Paying BDCs
Public for > 2 Years (3)
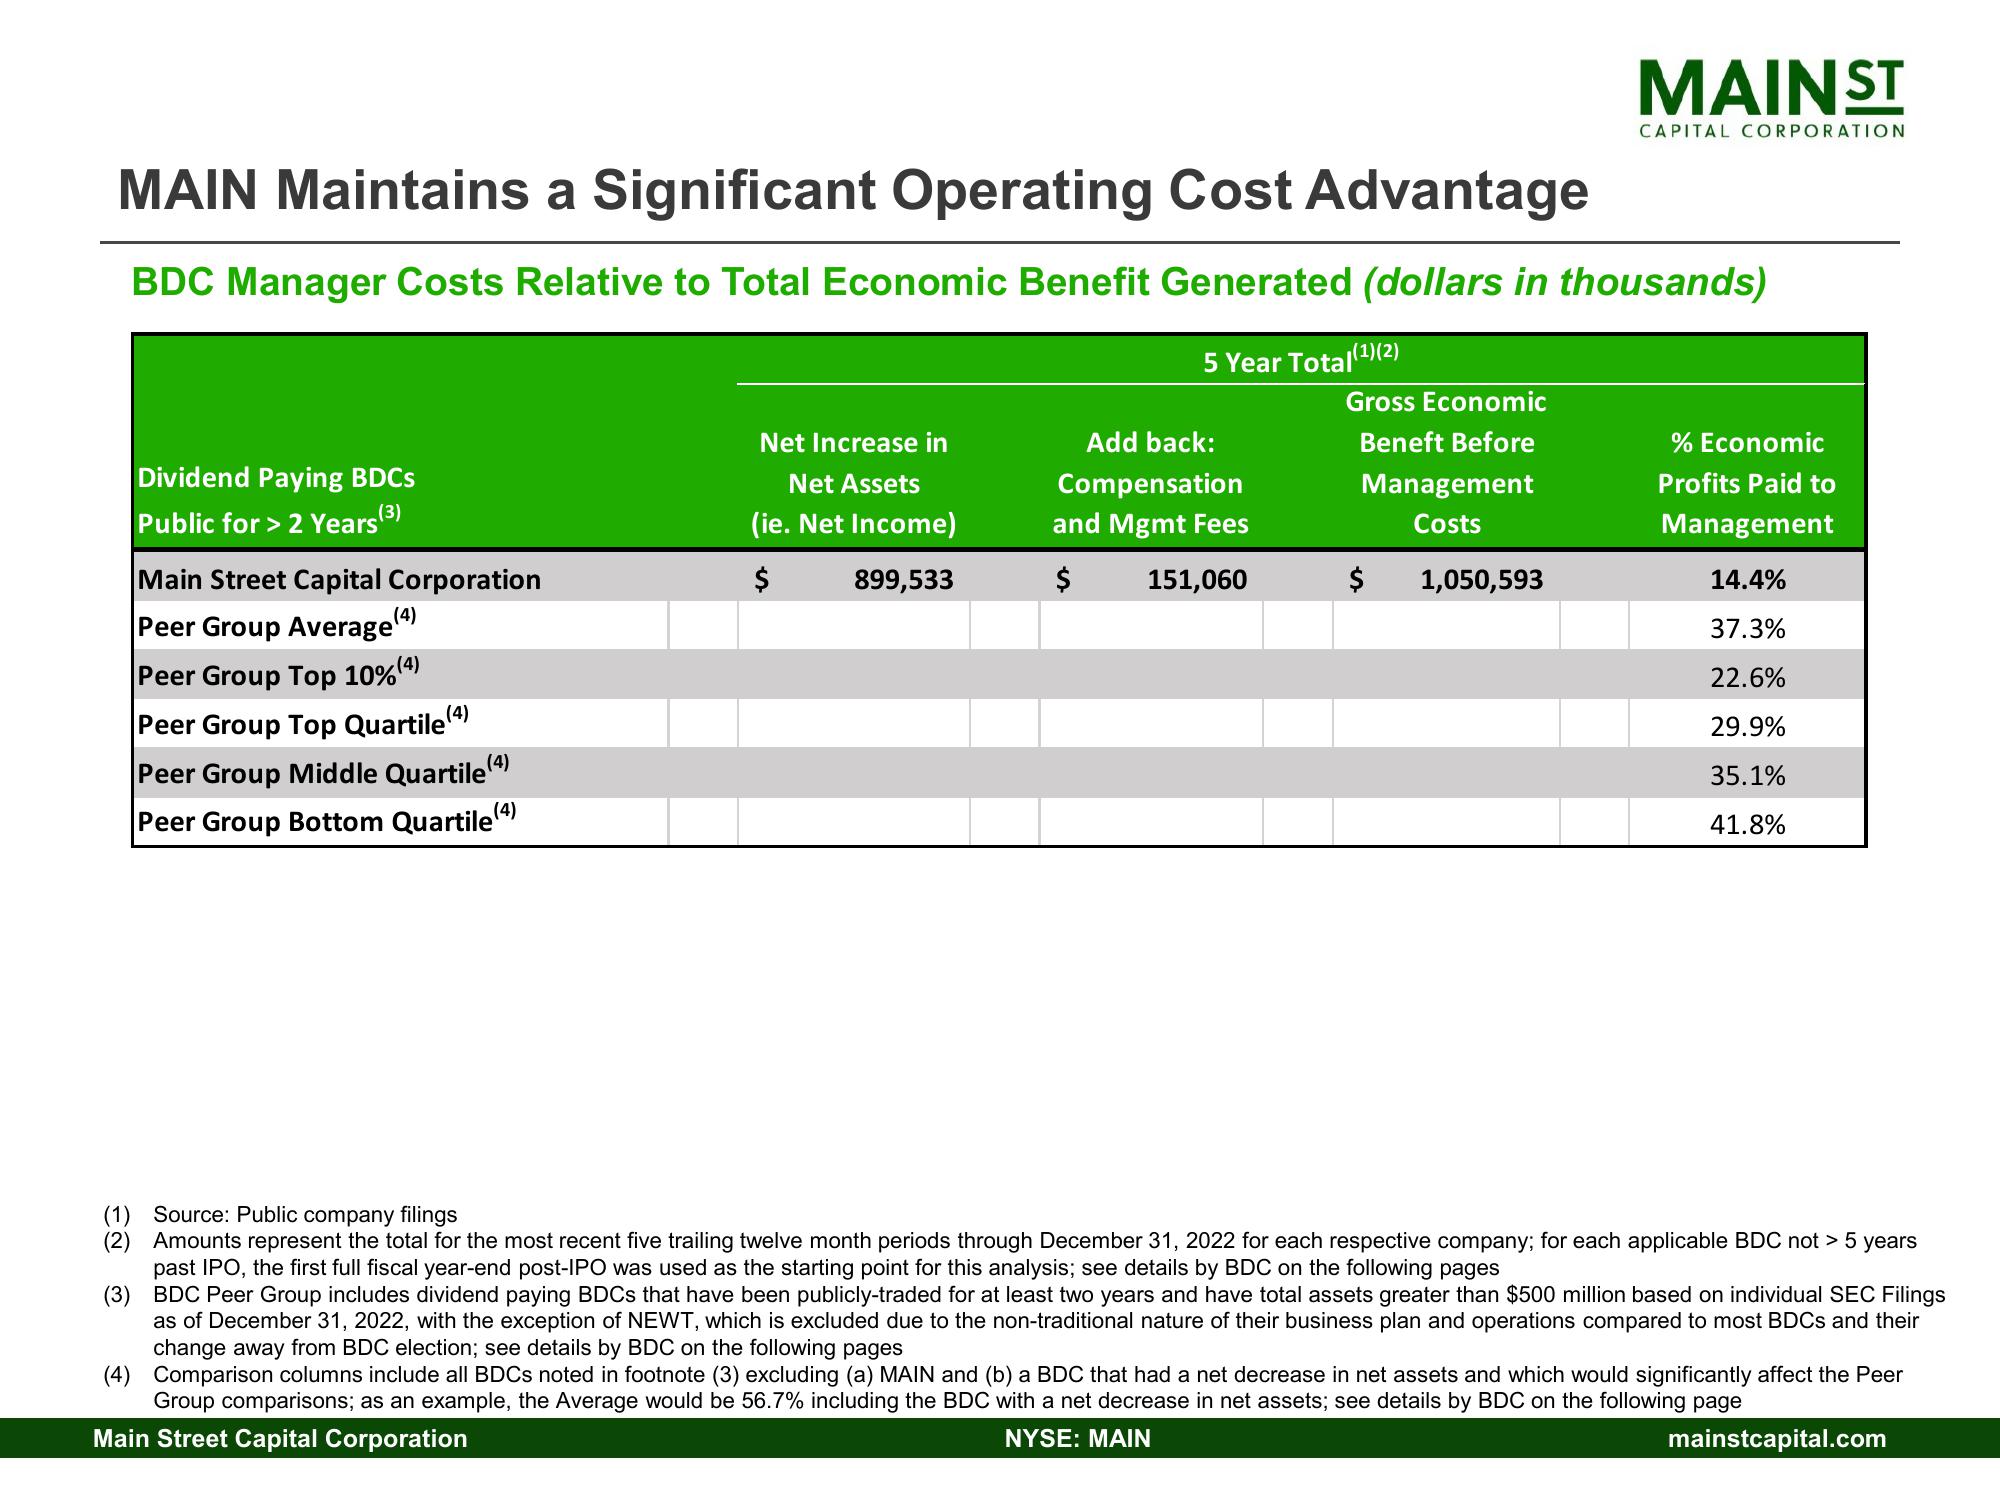
MAIN Maintains a Significant Operating Cost Advantage
BDC Manager Costs Relative to Total Economic Benefit Generated (dollars in thousands)
5 Year Total(¹)(2)
Main Street Capital Corporation
Peer Group Average (4)
Peer Group Top 10%(4)
Peer Group Top Quartile(4)
Peer Group Middle Quartile (4
Peer Group Bottom Quartile (4
Net Increase in
Net Assets
(ie. Net Income)
$
899,533
Add back:
Compensation
and Mgmt Fees
$ 151,060
Gross Economic
Beneft Before
Management
Costs
$
MAINST
1,050,593
CAPITAL CORPORATION
% Economic
Profits Paid to
Management
14.4%
37.3%
22.6%
29.9%
35.1%
41.8%
(1) Source: Public company filings
(2) Amounts represent the total for the most recent five trailing twelve month periods through December 31, 2022 for each respective company; for each applicable BDC not > 5 years
past IPO, the first full fiscal year-end post-IPO was used as the starting point for this analysis; see details by BDC on the following pages
(3)
BDC Peer Group includes dividend paying BDCs that have been publicly-traded for at least two years and have total assets greater than $500 million based on individual SEC Filings
as of December 31, 2022, with the exception of NEWT, which is excluded due to the non-traditional nature of their business plan and operations compared to most BDCs and their
change away from BDC election; see details by BDC on the following pages
(4) Comparison columns include all BDCs noted in footnote (3) excluding (a) MAIN and (b) a BDC that had a net decrease in net assets and which would significantly affect the Peer
Group comparisons; as an example, the Average would be 56.7% including the BDC with a net decrease in net assets; see details by BDC on the following page
Main Street Capital Corporation
NYSE: MAIN
mainstcapital.comView entire presentation