Dutch Bros Results Presentation Deck
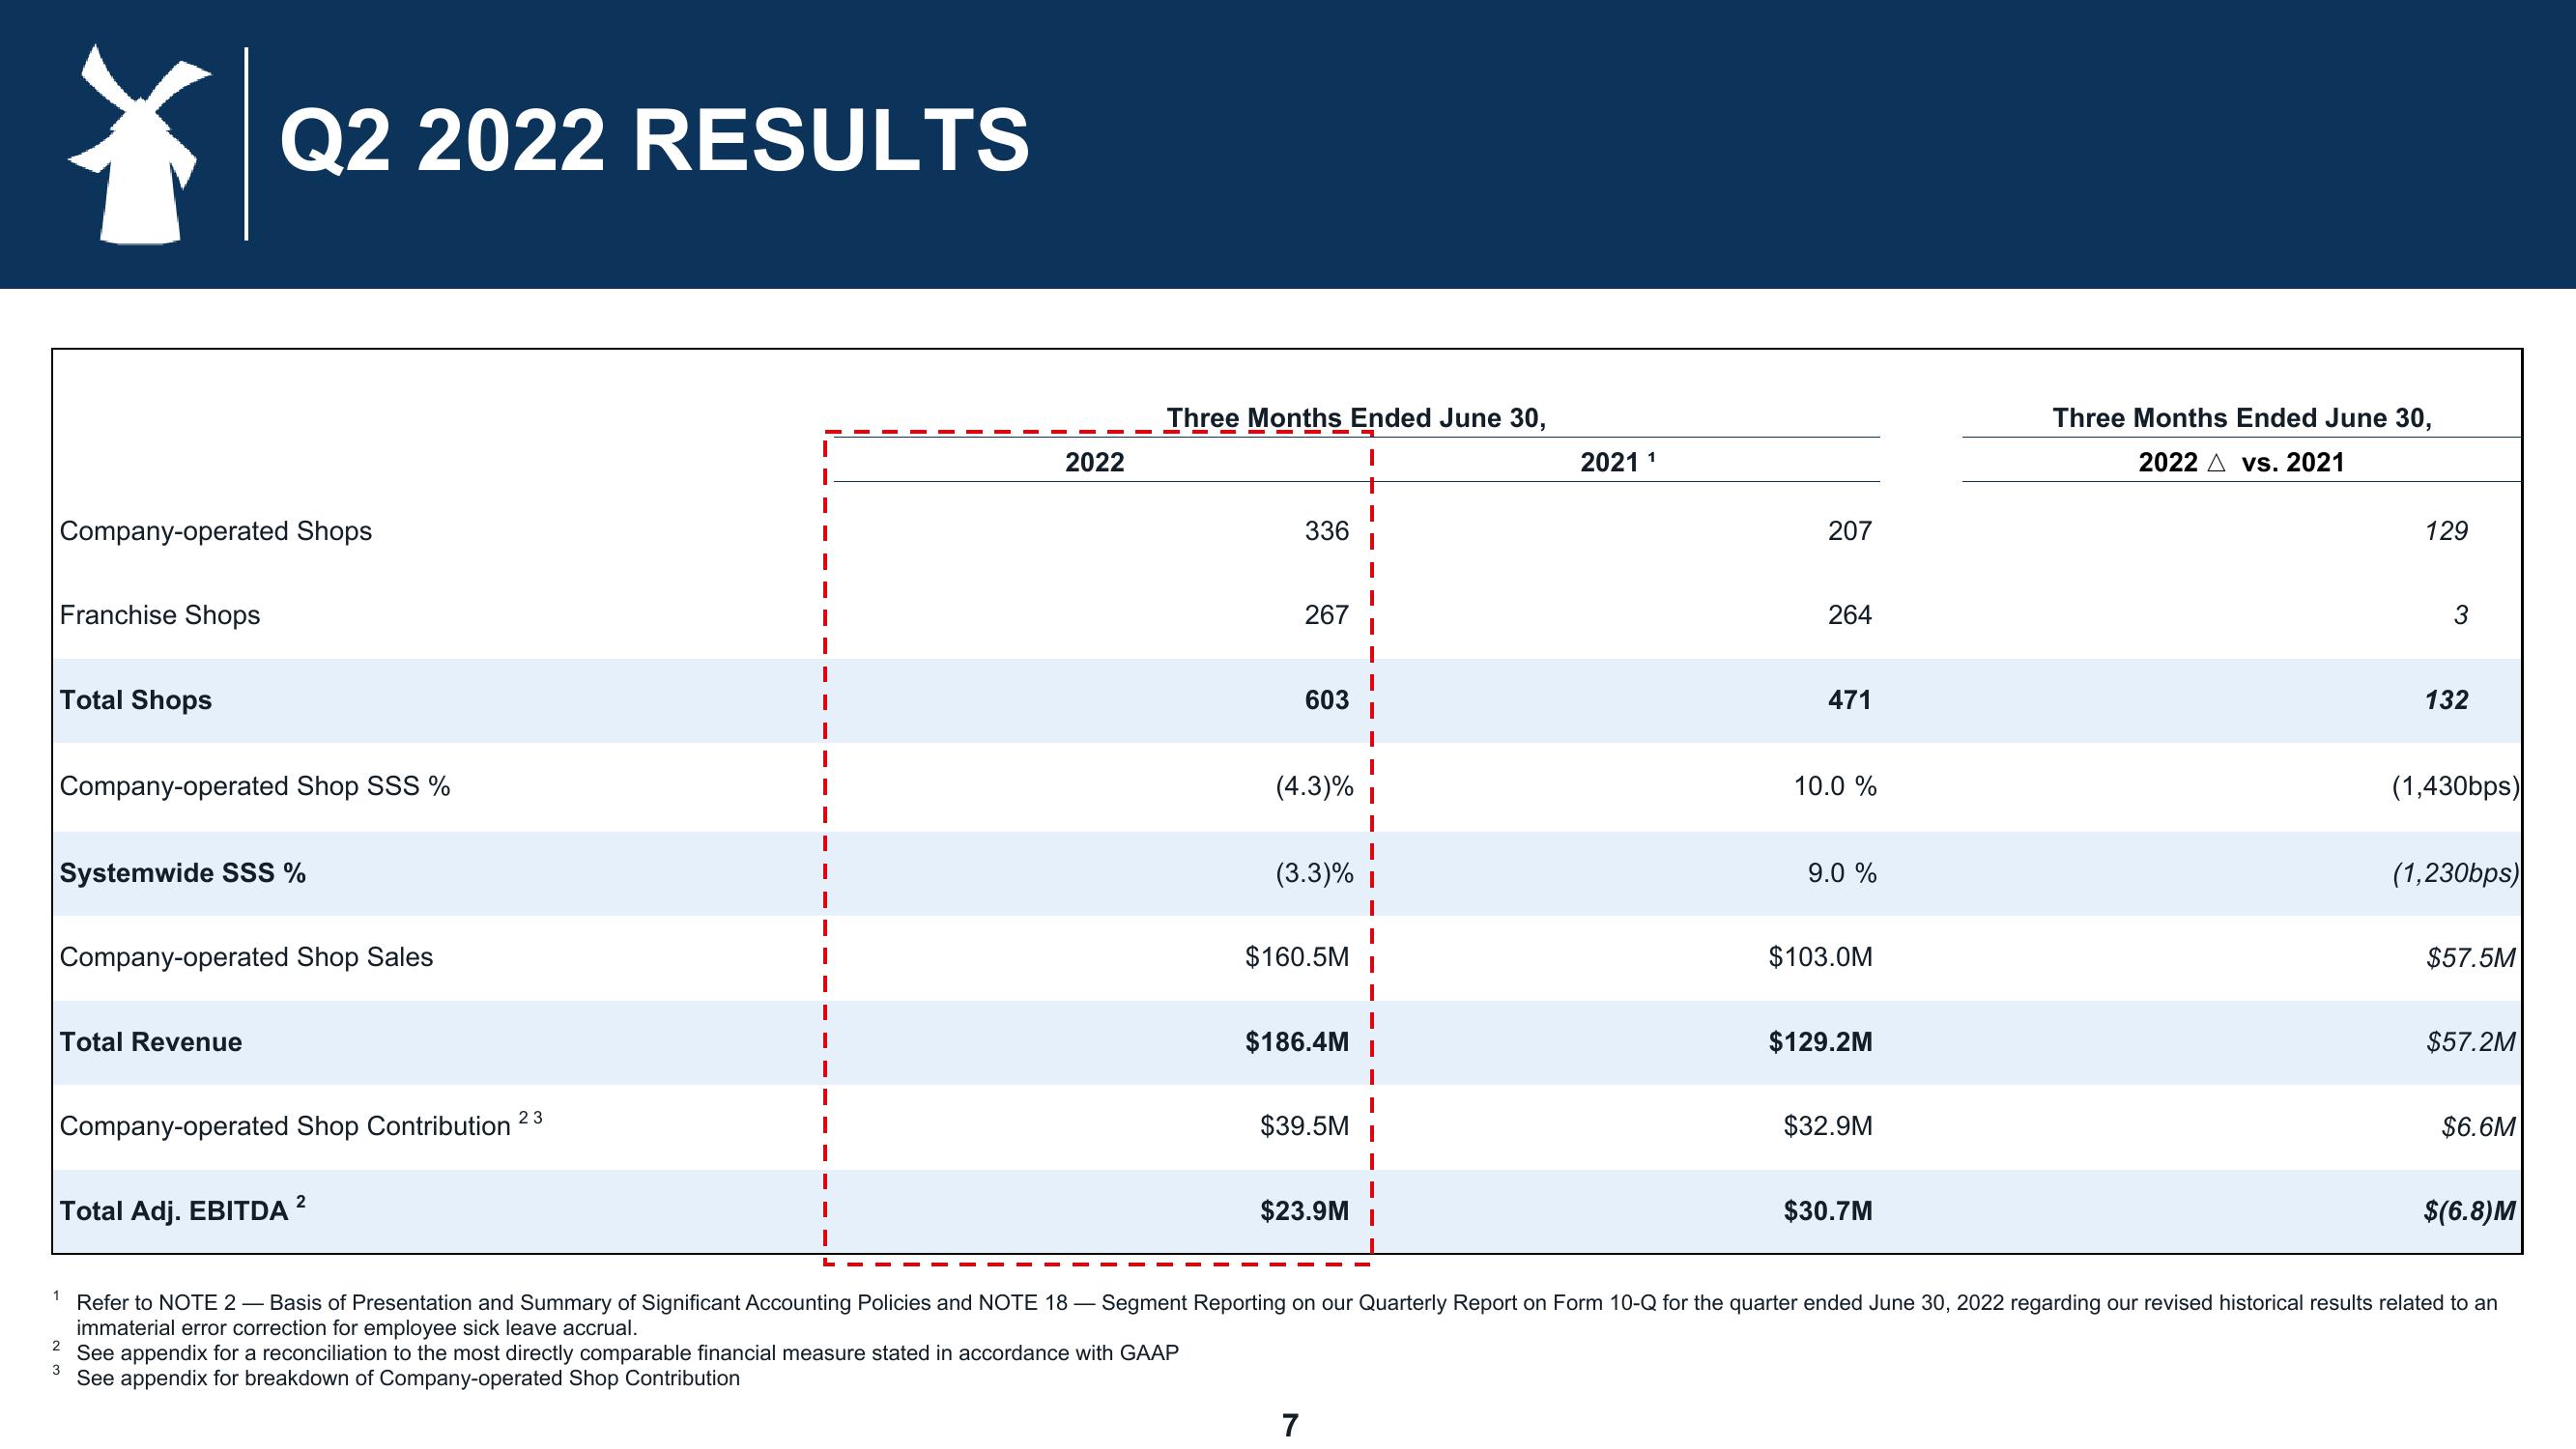
Company-operated Shops
Franchise Shops
Total Shops
Company-operated Shop SSS %
Q2 2022 RESULTS
Systemwide SSS %
Company-operated Shop Sales
Total Revenue
Company-operated Shop Contribution
Total Adj. EBITDA ²
2
3
23
2022
Three Months Ended June 30,
336
267
603
(4.3)%
(3.3)%
$160.5M
$186.4M
$39.5M
7
$23.9M
2021 1
207
264
471
10.0 %
9.0 %
$103.0M
$129.2M
$32.9M
$30.7M
Three Months Ended June 30,
2022 A vs. 2021
129
3
132
(1,430bps)
(1,230bps)
$57.5M
$57.2M
1 Refer to NOTE 2 - Basis of Presentation and Summary of Significant Accounting Policies and NOTE 18 — Segment Reporting on our Quarterly Report on Form 10-Q for the quarter ended June 30, 2022 regarding our revised historical results related to an
immaterial error correction for employee sick leave accrual.
See appendix for a reconciliation to the most directly comparable financial measure stated in accordance with GAAP
See appendix for breakdown of Company-operated Shop Contribution
$6.6M
$(6.8) MView entire presentation