IGI SPAC Presentation Deck
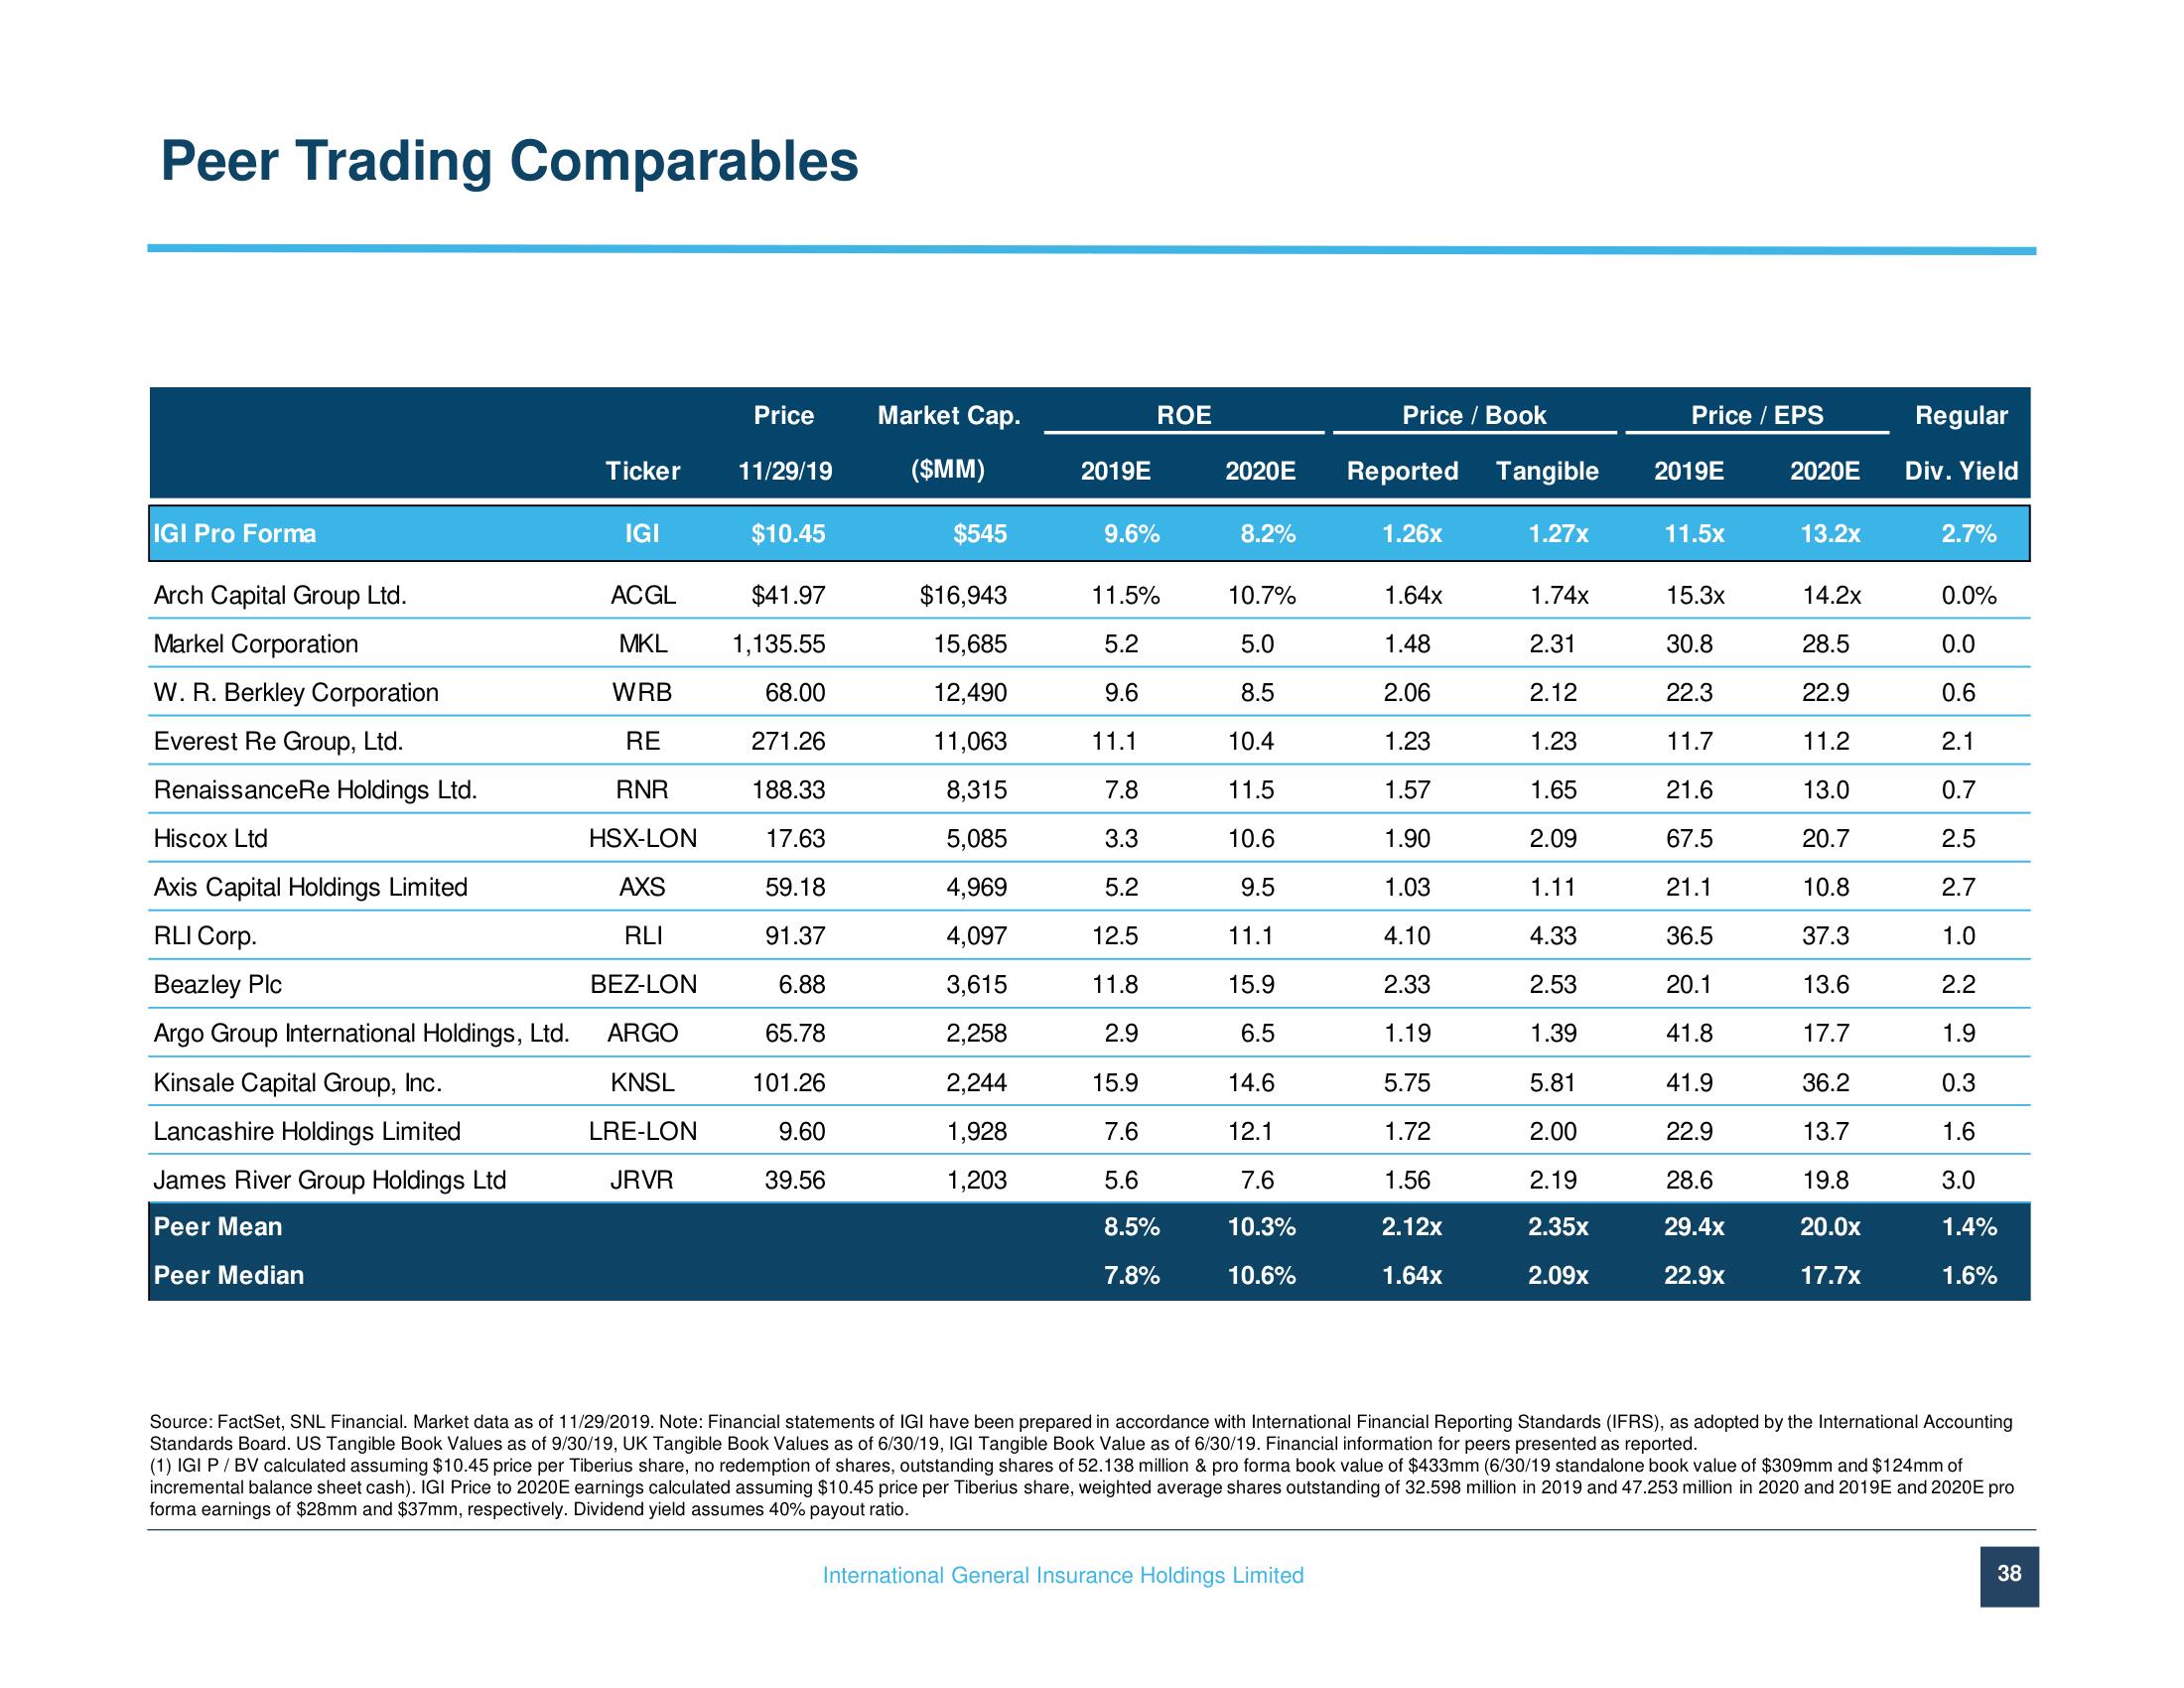
Peer Trading Comparables
IGI Pro Forma
Arch Capital Group Ltd.
Markel Corporation
W. R. Berkley Corporation
Everest Re Group, Ltd.
RenaissanceRe Holdings Ltd.
Hiscox Ltd
Axis Capital Holdings Limited
RLI Corp.
Beazley Plc
Argo Group International Holdings, Ltd.
Kinsale Capital Group, Inc.
Lancashire Holdings Limited
James River Group Holdings Ltd
Peer Mean
Peer Median
Ticker
IGI
ACGL
MKL
WRB
RE
RNR
HSX-LON
AXS
RLI
BEZ-LON
ARGO
KNSL
LRE-LON
JRVR
Price
11/29/19
$10.45
$41.97
1,135.55
68.00
271.26
188.33
17.63
59.18
91.37
6.88
65.78
101.26
9.60
39.56
Market Cap.
($MM)
$545
$16,943
15,685
12,490
11,063
8,315
5,085
4,969
4,097
3,615
2,258
2,244
1,928
1,203
2019E
ROE
9.6%
11.5%
5.2
9.6
11.1
7.8
3.3
5.2
12.5
11.8
2.9
15.9
7.6
5.6
8.5%
7.8%
2020E Reported Tangible
8.2%
10.7%
5.0
8.5
10.4
11.5
10.6
9.5
11.1
15.9
6.5
14.6
12.1
7.6
10.3%
10.6%
Price / Book
International General Insurance Holdings Limited
1.26x
1.64x
1.48
2.06
1.23
1.57
1.90
1.03
4.10
2.33
1.19
5.75
1.72
1.56
2.12x
1.64x
1.27x
1.74x
2.31
2.12
1.23
1.65
2.09
1.11
4.33
2.53
1.39
5.81
2.00
2.19
2.35x
2.09x
Price / EPS
2019E
11.5x
15.3x
30.8
22.3
11.7
21.6
67.5
21.1
36.5
20.1
41.8
41.9
22.9
28.6
29.4x
22.9x
2020E
13.2x
14.2x
28.5
22.9
11.2
13.0
20.7
10.8
37.3
13.6
17.7
36.2
13.7
19.8
20.0x
17.7x
Regular
Div. Yield
2.7%
0.0%
0.0
0.6
2.1
0.7
2.5
2.7
1.0
2.2
1.9
0.3
1.6
3.0
1.4%
1.6%
Source: FactSet, SNL Financial. Market data as of 11/29/2019. Note: Financial statements of IGI have been prepared in accordance with International Financial Reporting Standards (IFRS), as adopted by the International Accounting
Standards Board. US Tangible Book Values as of 9/30/19, UK Tangible Book Values as of 6/30/19, IGI Tangible Book Value as of 6/30/19. Financial information for peers presented as reported.
(1) IGI P / BV calculated assuming $10.45 price per Tiberius share, no redemption of shares, outstanding shares of 52.138 million & pro forma book value of $433mm (6/30/19 standalone book value of $309mm and $124mm of
incremental balance sheet cash). IGI Price to 2020E earnings calculated assuming $10.45 price per Tiberius share, weighted average shares outstanding of 32.598 million in 2019 and 47.253 million in 2020 and 2019E and 2020E pro
forma earnings of $28mm and $37mm, respectively. Dividend yield assumes 40% payout ratio.
38View entire presentation