Q2 Quarter 2023
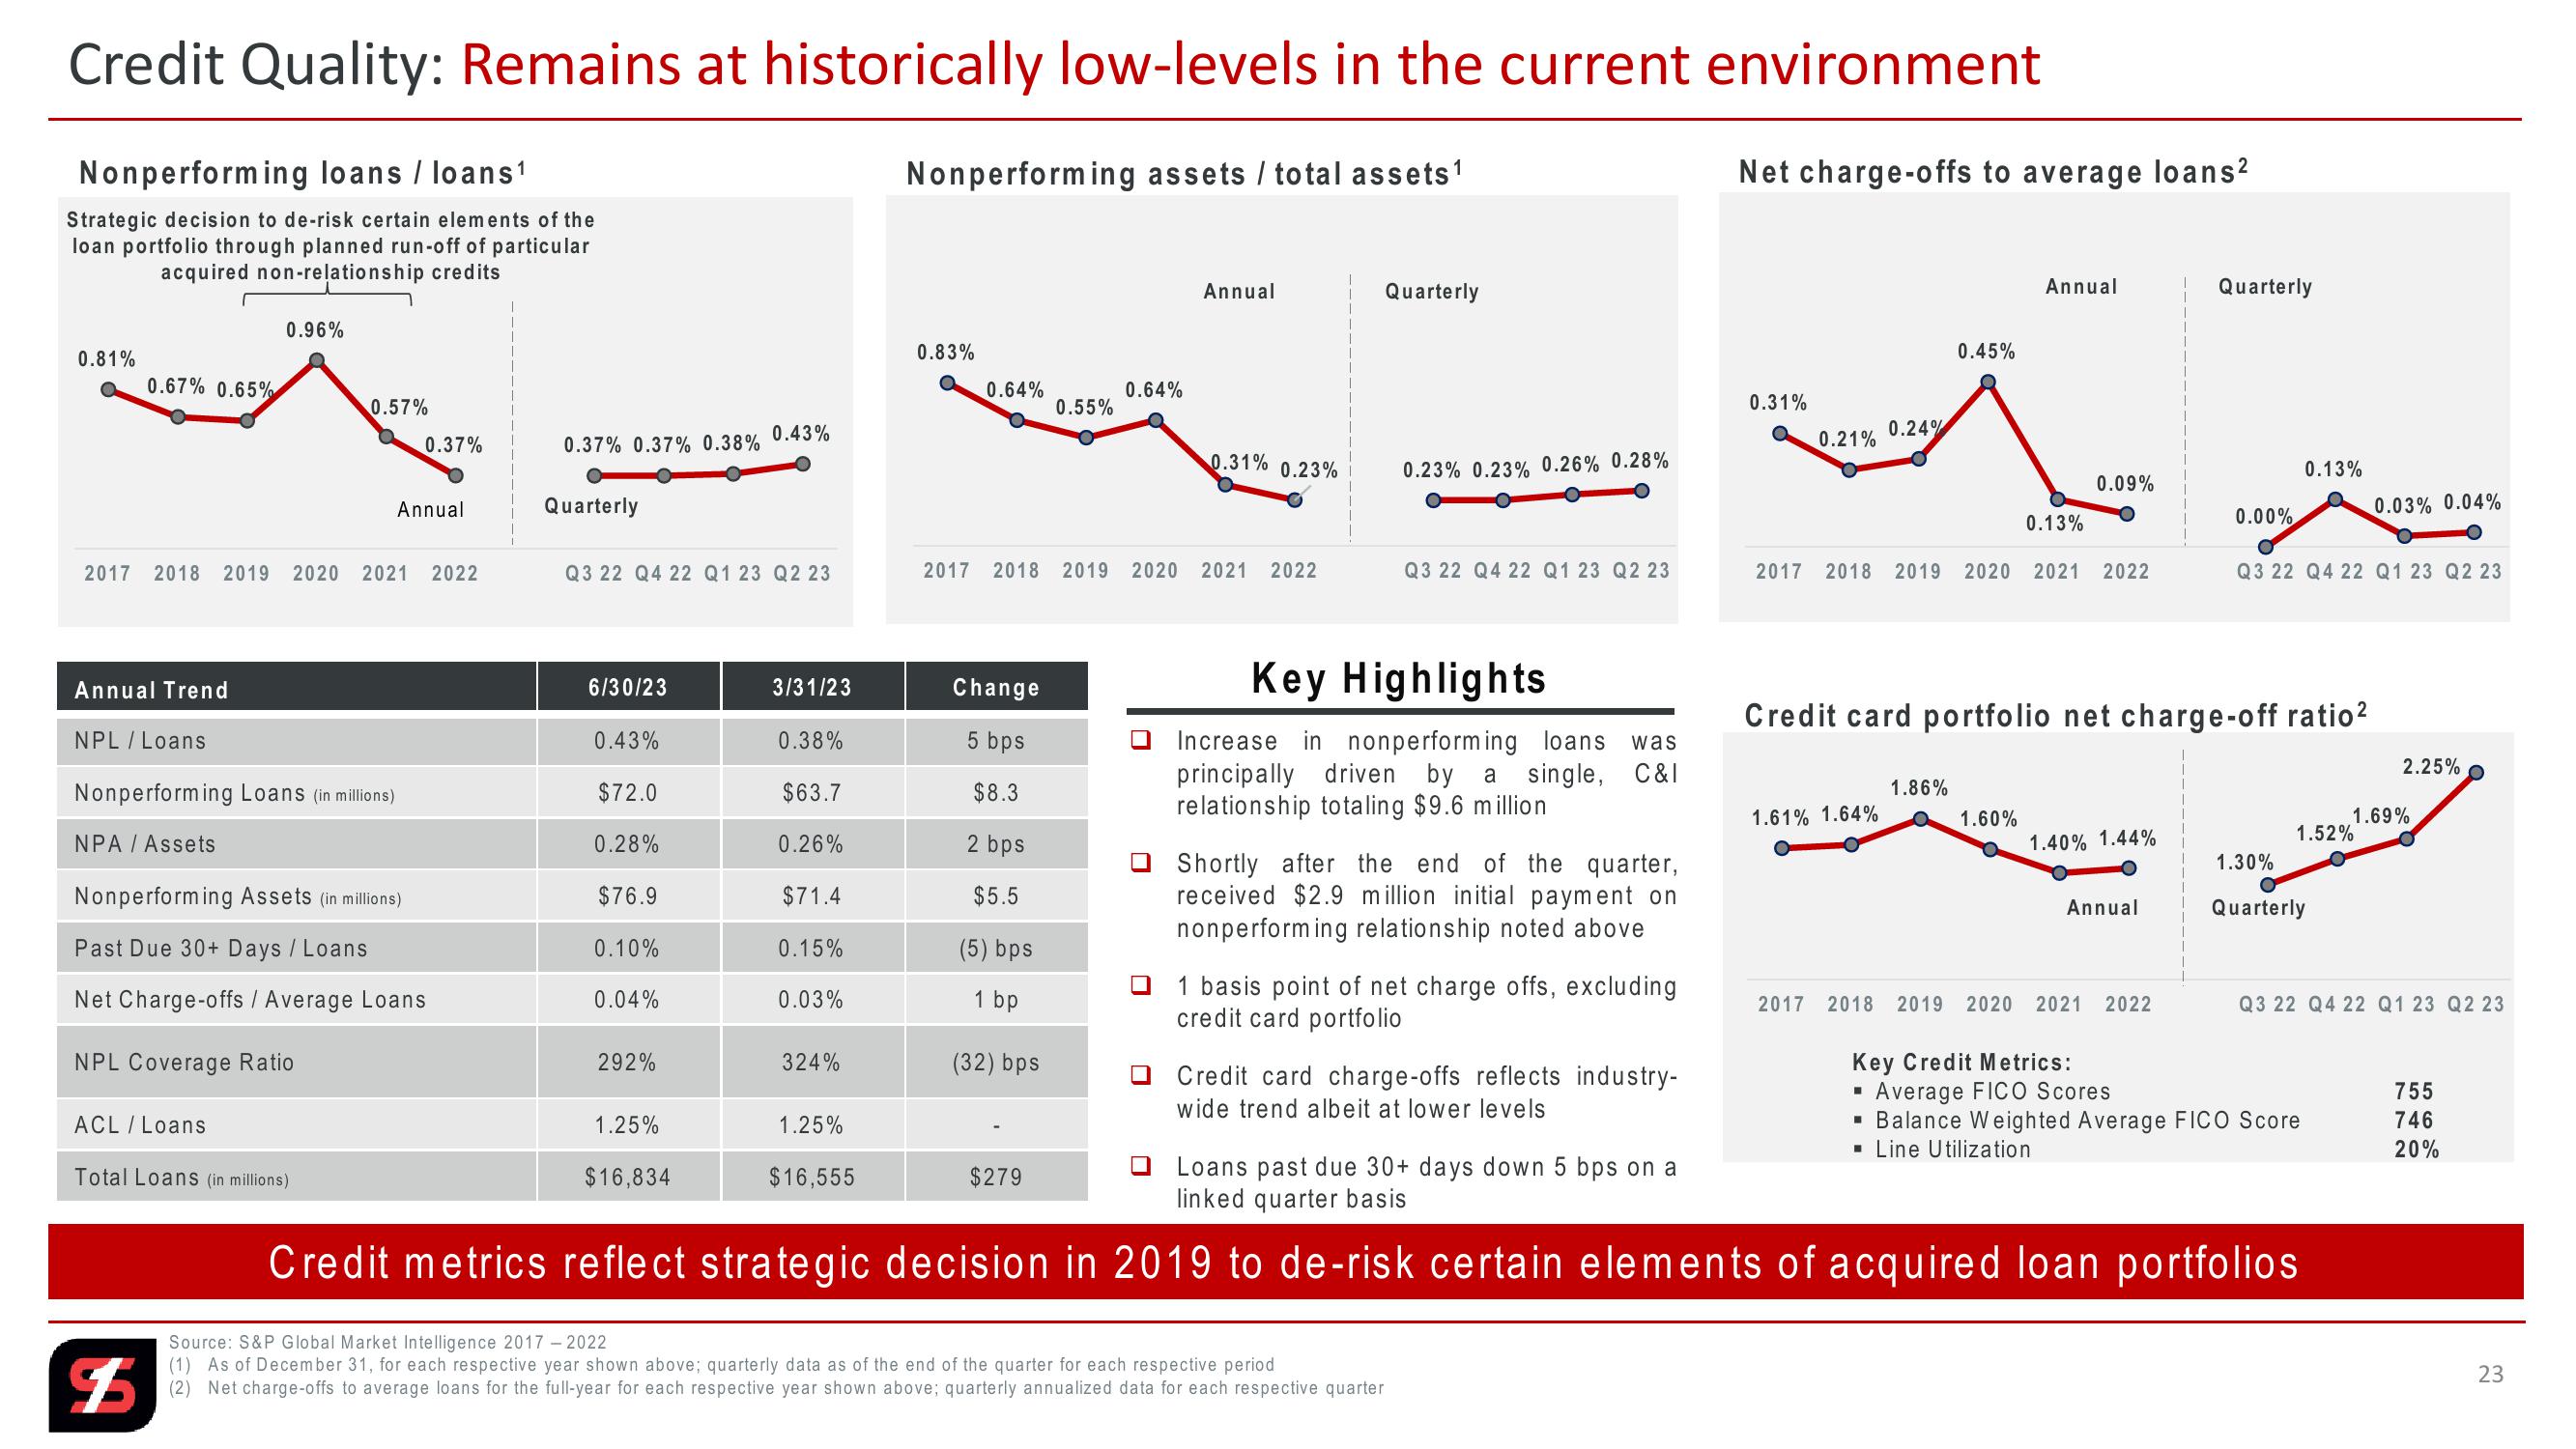
Credit Quality: Remains at historically low-levels in the current environment
Nonperforming loans / loans1
Strategic decision to de-risk certain elements of the
loan portfolio through planned run-off of particular
acquired non-relationship credits
Nonperforming assets/total assets¹
Net charge-offs to average loans²
Annual
Quarterly
Annual
Quarterly
0.96%
0.81%
0.67% 0.65%
0.57%
0.43%
0.37%
0.37% 0.37% 0.38%
Annual
Quarterly
0.83%
0.64%
0.64%
0.55%
0.45%
0.31%
0.24%
0.21%
0.31% 0.23%
0.23% 0.23% 0.26% 0.28%
0.13%
0.09%
0.03% 0.04%
0.13%
0.00%
2017 2018 2019 2020 2021 2022
Q3 22 Q4 22 Q1 23 Q2 23
2017
2018 2019 2020 2021 2022
Q3 22 Q4 22 Q1 23 Q2 23
2017 2018 2019 2020 2021 2022
Q3 22 Q4 22 Q1 23 Q2 23
Annual Trend
6/30/23
3/31/23
Change
NPL / Loans
0.43%
0.38%
5 bps
Nonperforming Loans (in millions)
$72.0
$63.7
$8.3
NPA / Assets
0.28%
0.26%
2 bps
Nonperforming Assets (in millions)
$76.9
$71.4
$5.5
Past Due 30+ Days / Loans
0.10%
0.15%
(5) bps
☐
Net Charge-offs / Average Loans
0.04%
0.03%
1 bp
NPL Coverage Ratio
292%
324%
(32) bps
ACL / Loans
Total Loans (in millions)
1.25%
$16,834
1.25%
$16,555
$279
Key Highlights
Increase in nonperforming loans was
principally driven by a single, C&I
relationship totaling $9.6 million
Shortly after the end of the quarter,
received $2.9 million initial payment on
nonperforming relationship noted above
1 basis point of net charge offs, excluding
credit card portfolio
Credit card charge-offs reflects industry-
wide trend albeit at lower levels
Loans past due 30+ days down 5 bps on a
linked quarter basis
Credit card portfolio net charge-off ratio²
2.25%
1.86%
1.61% 1.64%
1.60%
1.69%
1.40% 1.44%
1.52%
1.30%
Annual
Quarterly
2017 2018 2019 2020 2021 2022
Q3 22 Q4 22 Q1 23 Q2 23
Key Credit Metrics:
Average FICO Scores
■ Balance Weighted Average FICO Score
■ Line Utilization
Credit metrics reflect strategic decision in 2019 to de-risk certain elements of acquired loan portfolios
Source: S&P Global Market Intelligence 2017-2022
(1) As of December 31, for each respective year shown above; quarterly data as of the end of the quarter for each respective period
$5
(2) Net charge-offs to average loans for the full-year for each respective year shown above; quarterly annualized data for each respective quarter
755
746
20%
23View entire presentation