Engine No. 1 Activist Presentation Deck
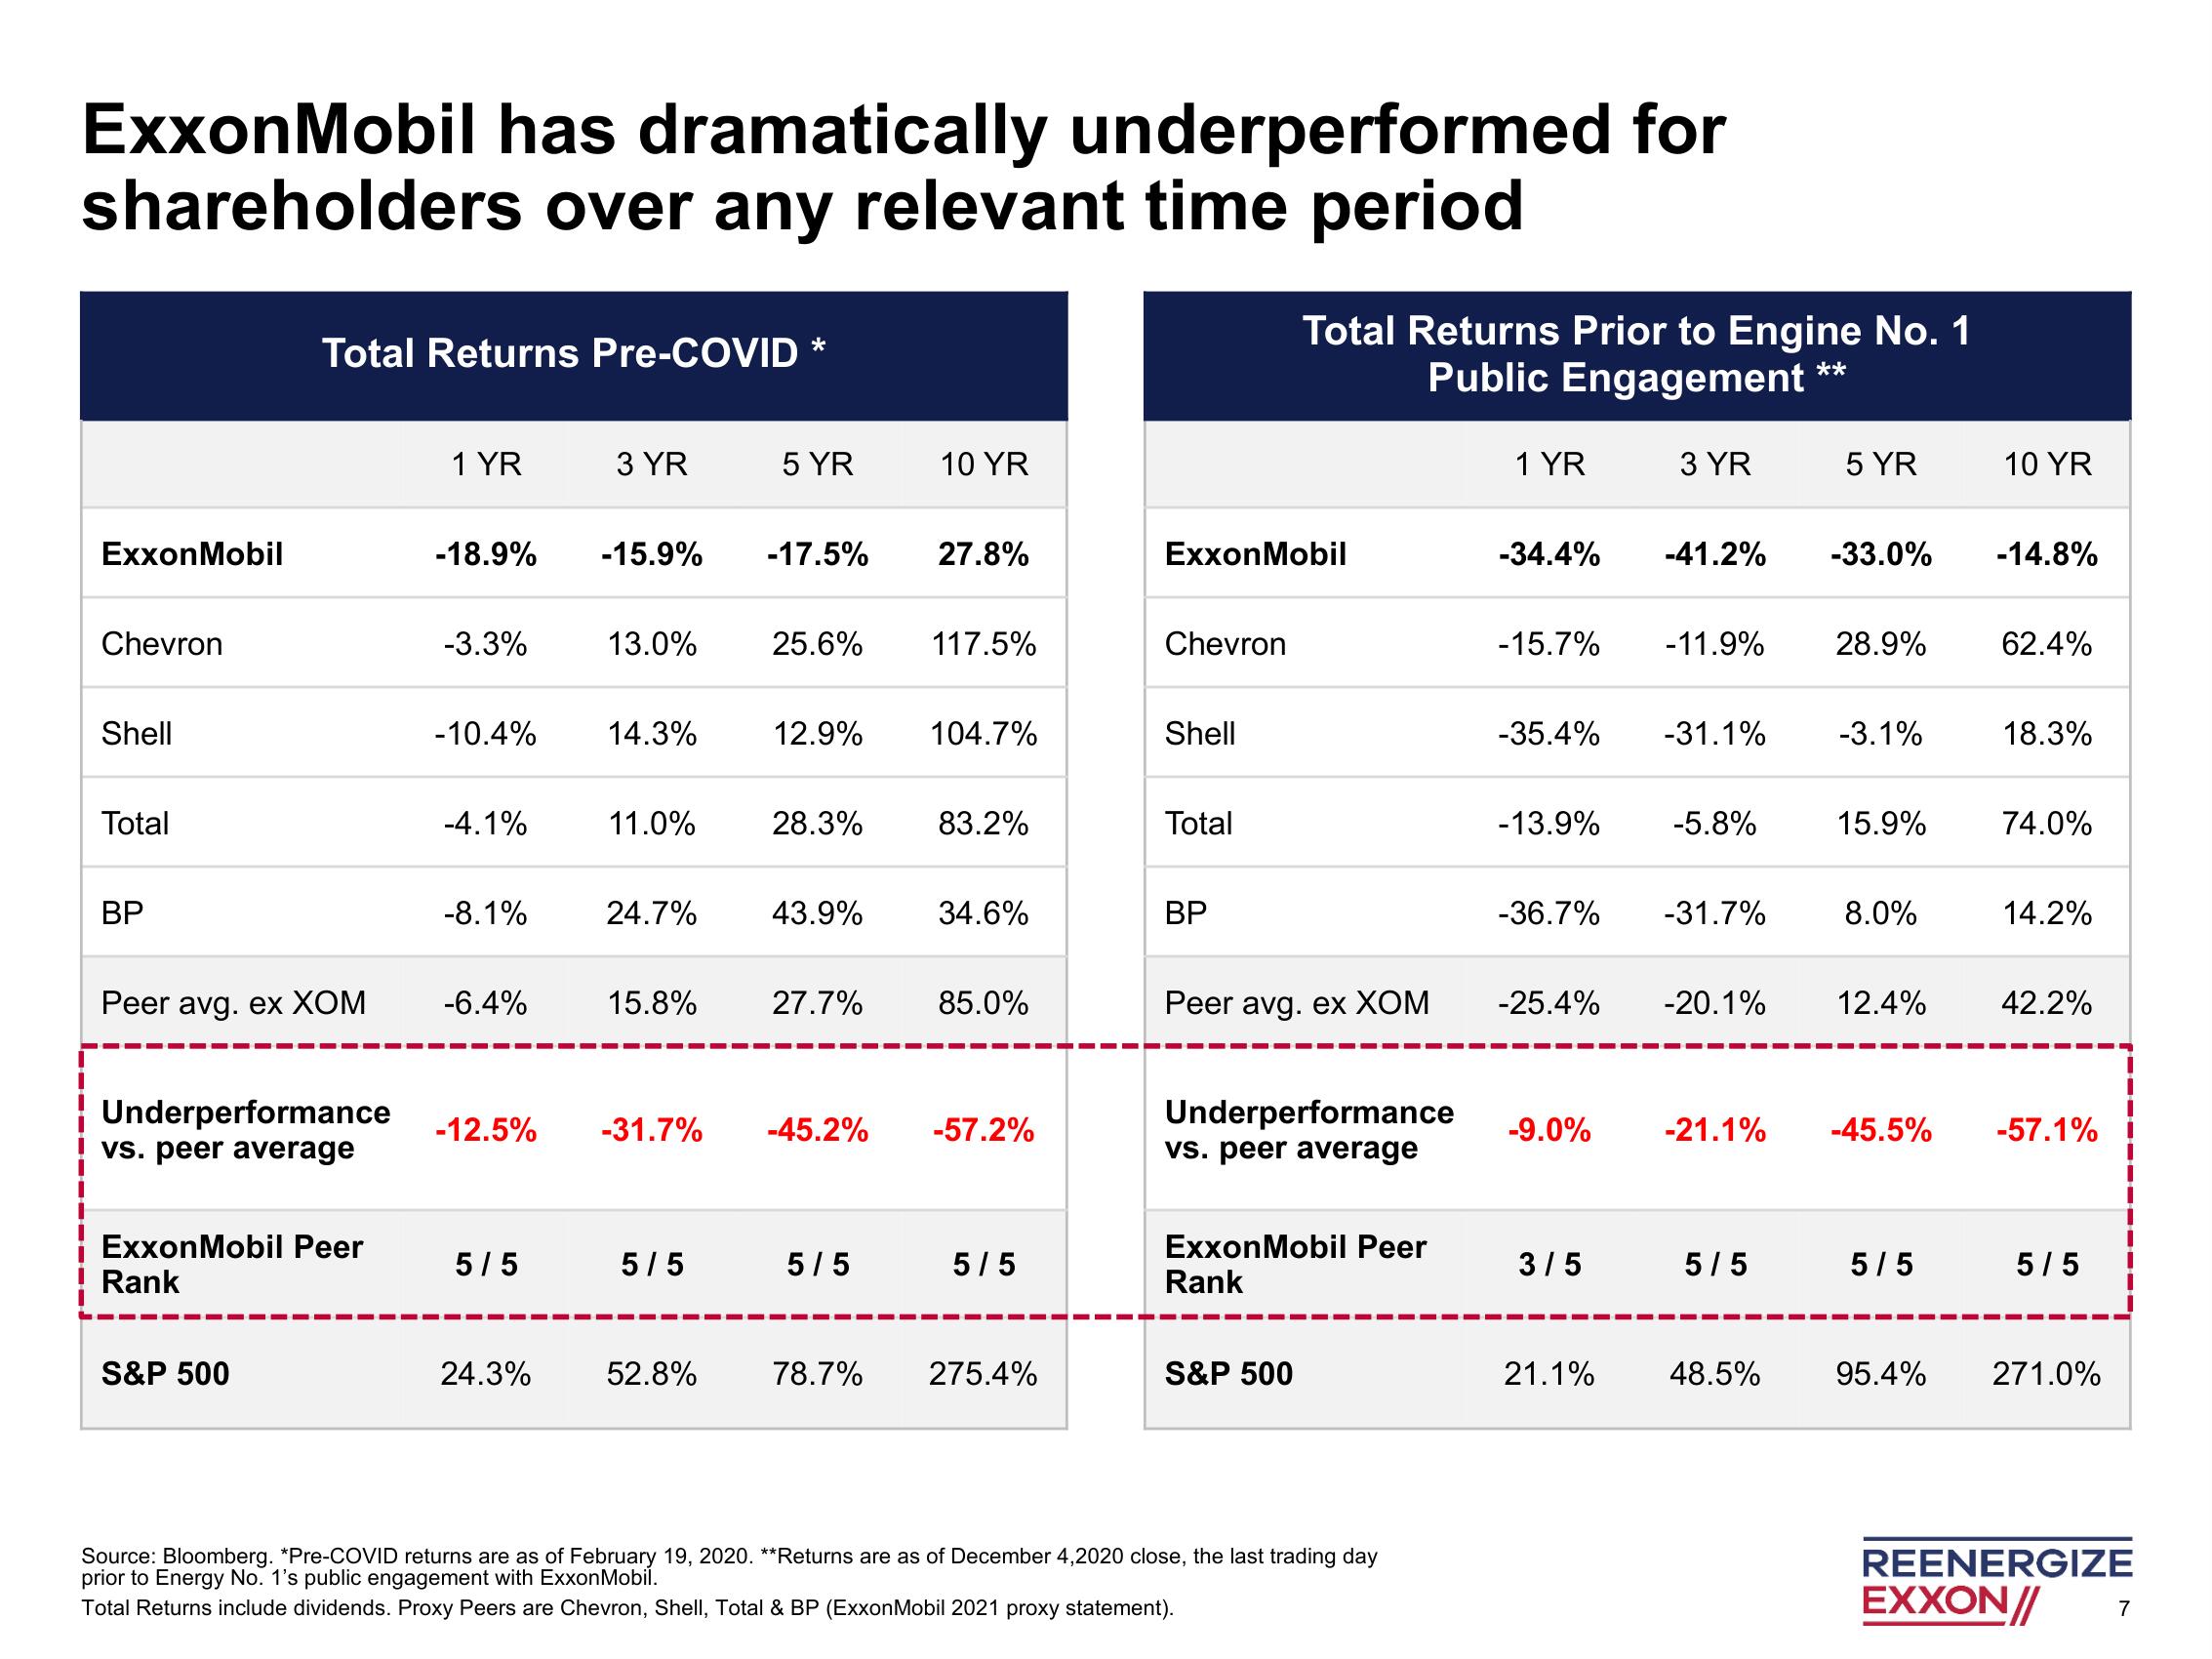
ExxonMobil has dramatically underperformed for
shareholders over any relevant time period
ExxonMobil
Chevron
Shell
Total
BP
Total Returns Pre-COVID*
Peer avg. ex XOM
Underperformance
vs. peer average
ExxonMobil Peer
Rank
S&P 500
1 YR
-18.9%
-3.3%
-10.4%
-4.1%
-8.1%
-6.4%
-12.5%
5/5
24.3%
3 YR
-15.9%
13.0%
14.3%
11.0%
24.7%
15.8%
5/5
5 YR
52.8%
-17.5%
25.6%
12.9%
28.3%
43.9%
27.7%
5/5
10 YR
78.7%
27.8%
117.5%
104.7%
-31.7% -45.2% -57.2%
83.2%
34.6%
85.0%
5/5
275.4%
ExxonMobil
Chevron
Shell
Total
BP
Total Returns Prior to Engine No. 1
Public Engagement
**
Peer avg. ex XOM
Underperformance
vs. peer average
ExxonMobil Peer
Rank
S&P 500
Source: Bloomberg. *Pre-COVID returns are as of February 19, 2020. **Returns are as of December 4,2020 close, the last trading day
prior to Energy No. 1's public engagement with ExxonMobil.
Total Returns include dividends. Proxy Peers are Chevron, Shell, Total & BP (ExxonMobil 2021 proxy statement).
1 YR
-34.4%
-15.7%
-35.4%
-13.9%
-36.7%
-25.4%
-9.0%
3/5
21.1%
3 YR
-41.2% -33.0%
-11.9% 28.9%
-31.1%
-5.8%
-31.7%
-20.1%
5 YR
5/5
48.5%
-3.1%
15.9%
8.0%
12.4%
5/5
10 YR
95.4%
-14.8%
62.4%
18.3%
-21.1% -45.5% -57.1%
74.0%
14.2%
42.2%
5/5
271.0%
REENERGIZE
EXXON//
7View entire presentation