Advent Capital Balanced Strategy Update
BALANCED STRATEGY PERFORMANCE
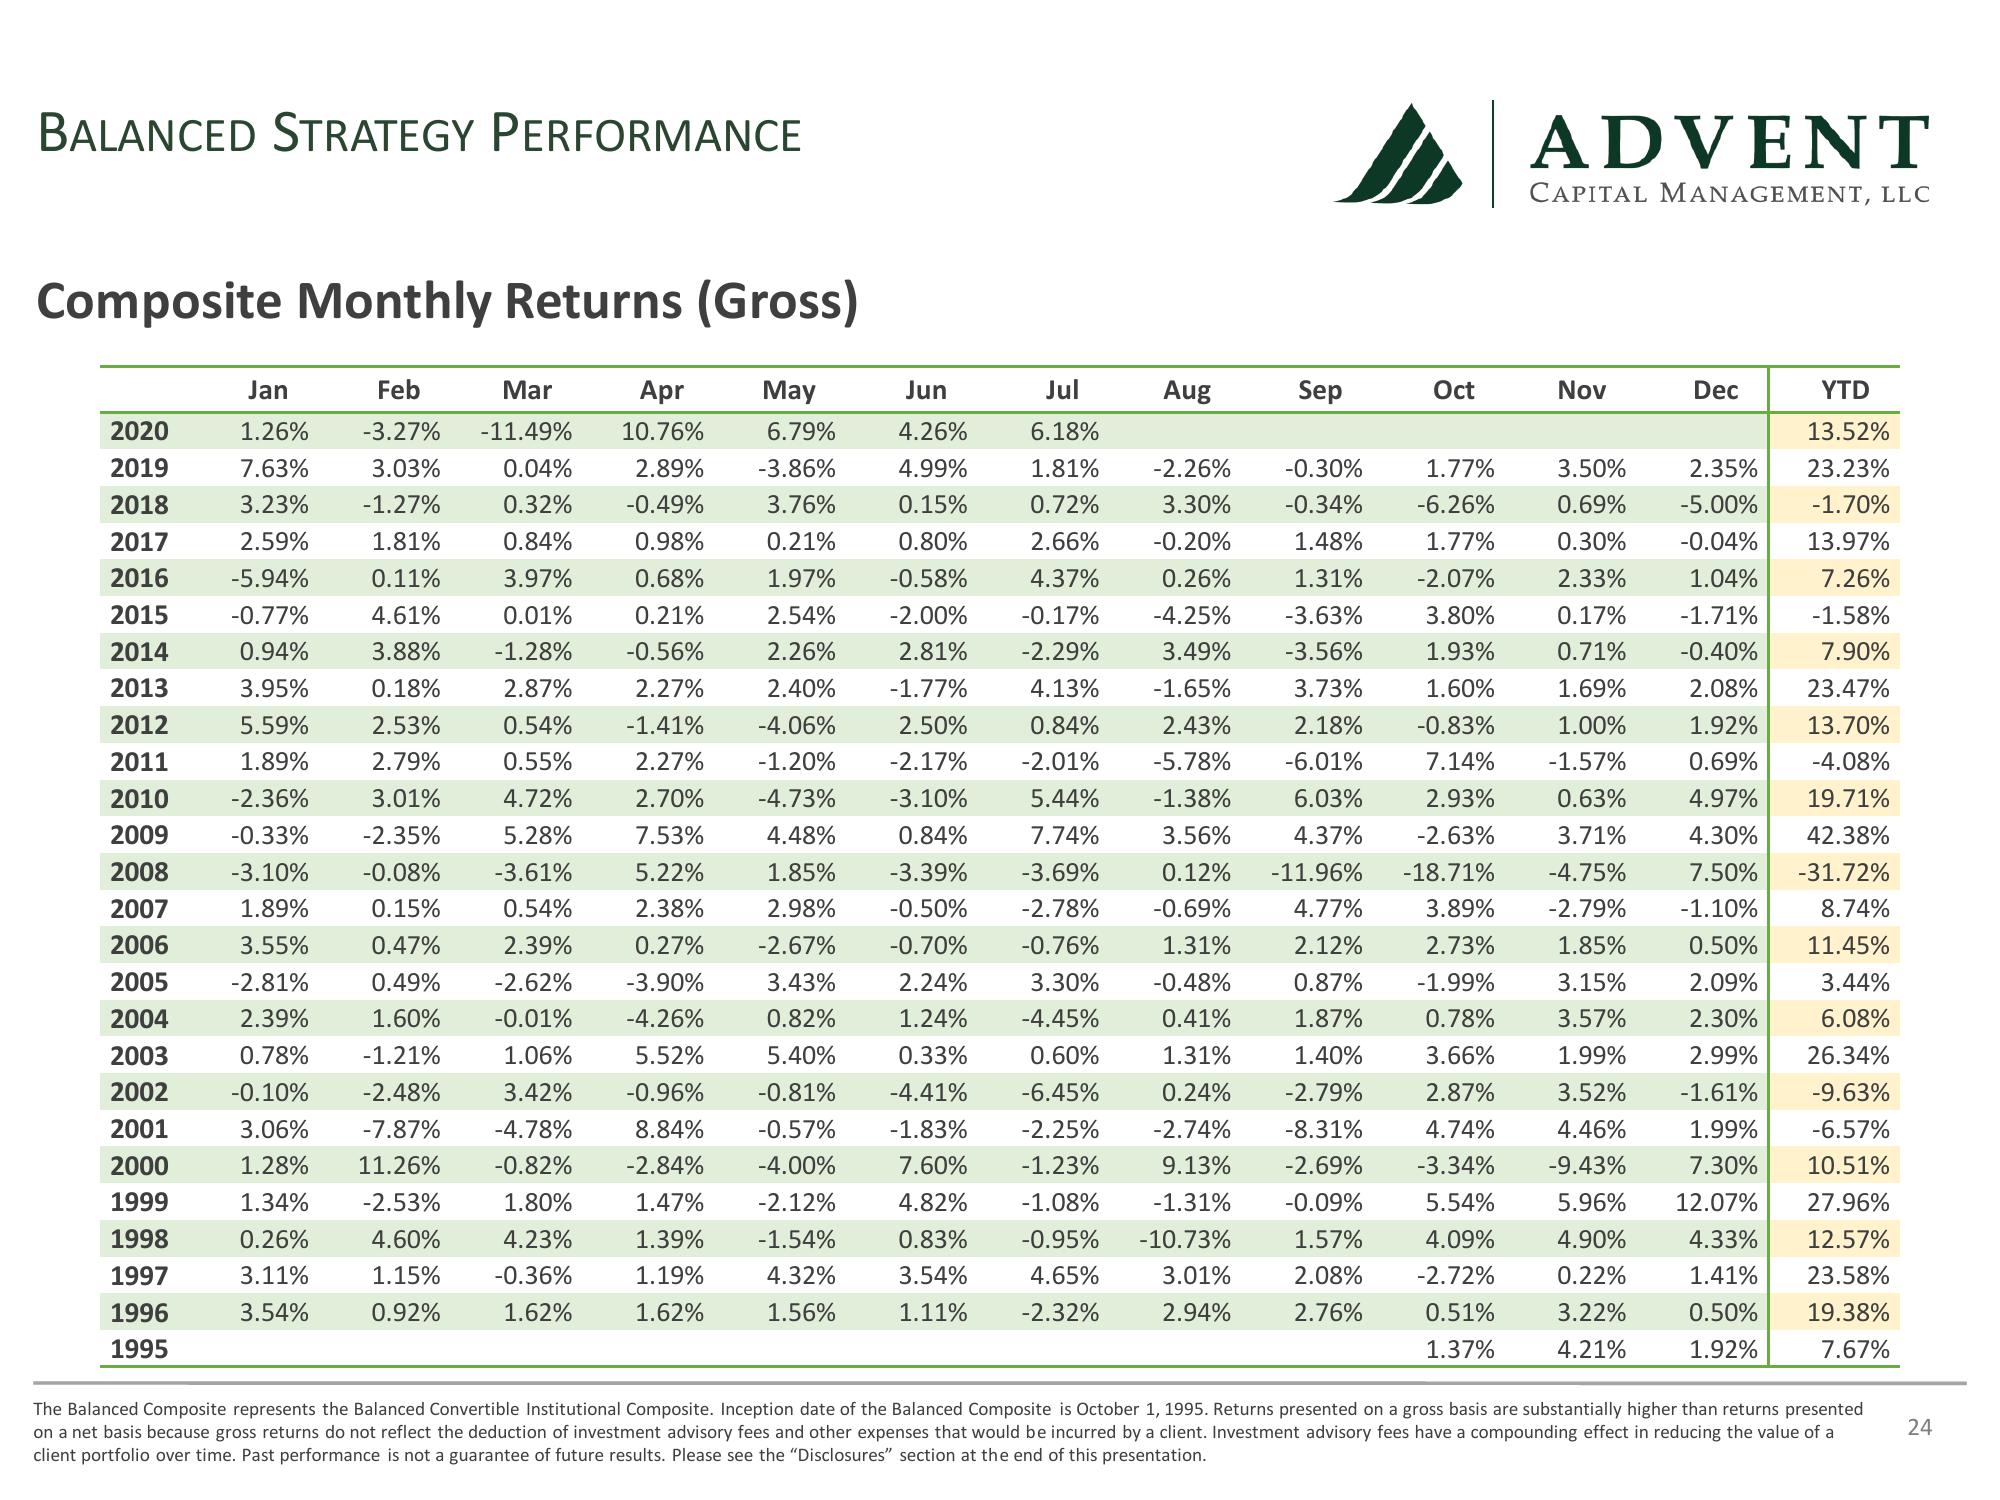
Composite Monthly Returns (Gross)
2020
2019
2018
2017
2016
2015
2014
2013
2012
2011
2010
2009
2008
2007
2006
2005
2004
2003
2002
2001
2000
1999
1998
1997
1996
1995
Jan
1.26%
7.63%
3.03%
3.23% -1.27%
2.59%
1.81%
-5.94%
0.11%
-0.77%
4.61%
0.94%
3.88%
3.95%
0.18%
5.59%
2.53%
1.89%
2.79%
-2.36%
3.01%
-0.33%
-2.35%
-3.10%
-0.08%
1.89%
0.15%
3.55%
0.47%
-2.81%
0.49%
2.39%
1.60%
0.78%
-1.21%
-0.10%
-2.48%
3.06% -7.87%
1.28% 11.26%
1.34%
-2.53%
0.26%
4.60%
3.11%
1.15%
3.54%
0.92%
Feb
Mar
Apr
-3.27% -11.49% 10.76%
May
Jun
6.79%
4.26%
0.04%
2.89% -3.86%
4.99%
0.32%
-0.49%
3.76%
0.15%
0.84%
0.98%
0.21%
0.80%
3.97%
0.68%
1.97%
-0.58%
0.01%
0.21%
2.54%
-2.00%
-1.28%
-0.56%
2.26%
2.81%
2.87%
2.27%
2.40% -1.77%
0.54%
-1.41%
-4.06%
2.50%
0.55%
2.27%
-1.20%
-2.17%
4.72%
2.70% -4.73%
-3.10%
5.28%
7.53%
4.48%
0.84%
-3.61%
5.22%
1.85%
-3.39%
0.54%
2.38%
2.98%
-0.50%
2.39%
0.27%
-2.67%
-0.70%
-2.62%
-3.90%
3.43%
2.24%
-0.01%
-4.26%
0.82%
1.24%
1.06%
5.52%
5.40%
0.33%
3.42% -0.96%
-0.81%
-4.41%
-4.78%
8.84%
-0.57%
-1.83%
-0.82%
-2.84%
-4.00%
7.60%
1.80%
1.47% -2.12%
4.82%
4.23%
1.39% -1.54%
0.83%
-0.36%
1.19%
4.32%
3.54% 4.65%
1.11% -2.32%
1.62%
1.62%
1.56%
Aug
Jul
6.18%
1.81%
-2.26%
-0.30%
0.72%
3.30%
-0.34%
2.66% -0.20%
1.48%
4.37%
0.26%
1.31%
-0.17% -4.25%
-3.63%
-2.29%
3.49%
-3.56%
4.13%
-1.65%
3.73%
0.84%
2.43%
2.18%
-2.01%
-5.78%
-6.01%
5.44%
-1.38%
6.03%
7.74%
3.56%
4.37%
-3.69%
0.12% -11.96%
-2.78%
-0.69%
4.77%
-0.76%
1.31%
2.12%
3.30%
-0.48%
0.87%
-4.45%
0.41%
1.87%
0.60%
1.31%
1.40%
-6.45%
0.24%
-2.79%
-2.25%
-2.74%
-8.31%
-1.23%
9.13%
-2.69%
-1.08%
-1.31%
-0.09%
-0.95% -10.73%
1.57%
3.01%
2.08%
2.94%
2.76%
Sep
Oct
YTD
13.52%
3.50%
2.35%
-5.00%
23.23%
-1.70%
-0.04% 13.97%
0.69%
0.30%
2.33%
1.04%
7.26%
0.17%
-1.71%
-1.58%
0.71%
-0.40%
7.90%
1.69%
2.08%
23.47%
1.00%
1.92% 13.70%
-1.57%
0.69%
-4.08%
0.63%
4.97%
19.71%
3.71%
4.30%
42.38%
-4.75%
7.50% -31.72%
3.89% -2.79%
-1.10%
8.74%
2.73%
1.85%
0.50%
11.45%
-1.99%
3.15%
2.09%
3.44%
0.78%
3.57%
2.30%
6.08%
3.66%
1.99%
2.99% 26.34%
2.87%
3.52%
-1.61%
4.74%
4.46%
1.99%
-3.34%
-9.43%
7.30%
5.54%
5.96% 12.07%
4.09%
4.90%
4.33%
-2.72%
0.22%
1.41%
0.51%
3.22%
0.50%
1.37%
4.21%
1.92%
ADVENT
CAPITAL MANAGEMENT, LLC
1.77%
-6.26%
1.77%
-2.07%
3.80%
1.93%
1.60%
-0.83%
7.14%
2.93%
-2.63%
-18.71%
Nov
Dec
-9.63%
-6.57%
10.51%
27.96%
12.57%
23.58%
19.38%
7.67%
The Balanced Composite represents the Balanced Convertible Institutional Composite. Inception date of the Balanced Composite is October 1, 1995. Returns presented on a gross basis are substantially higher than returns presented
on a net basis because gross returns do not reflect the deduction of investment advisory fees and other expenses that would be incurred by a client. Investment advisory fees have a compounding effect in reducing the value of a
client portfolio over time. Past performance is not a guarantee of future results. Please see the "Disclosures" section at the end of this presentation.
24View entire presentation