dLocal Results Presentation Deck slide image

dLocal Results Presentation Deck

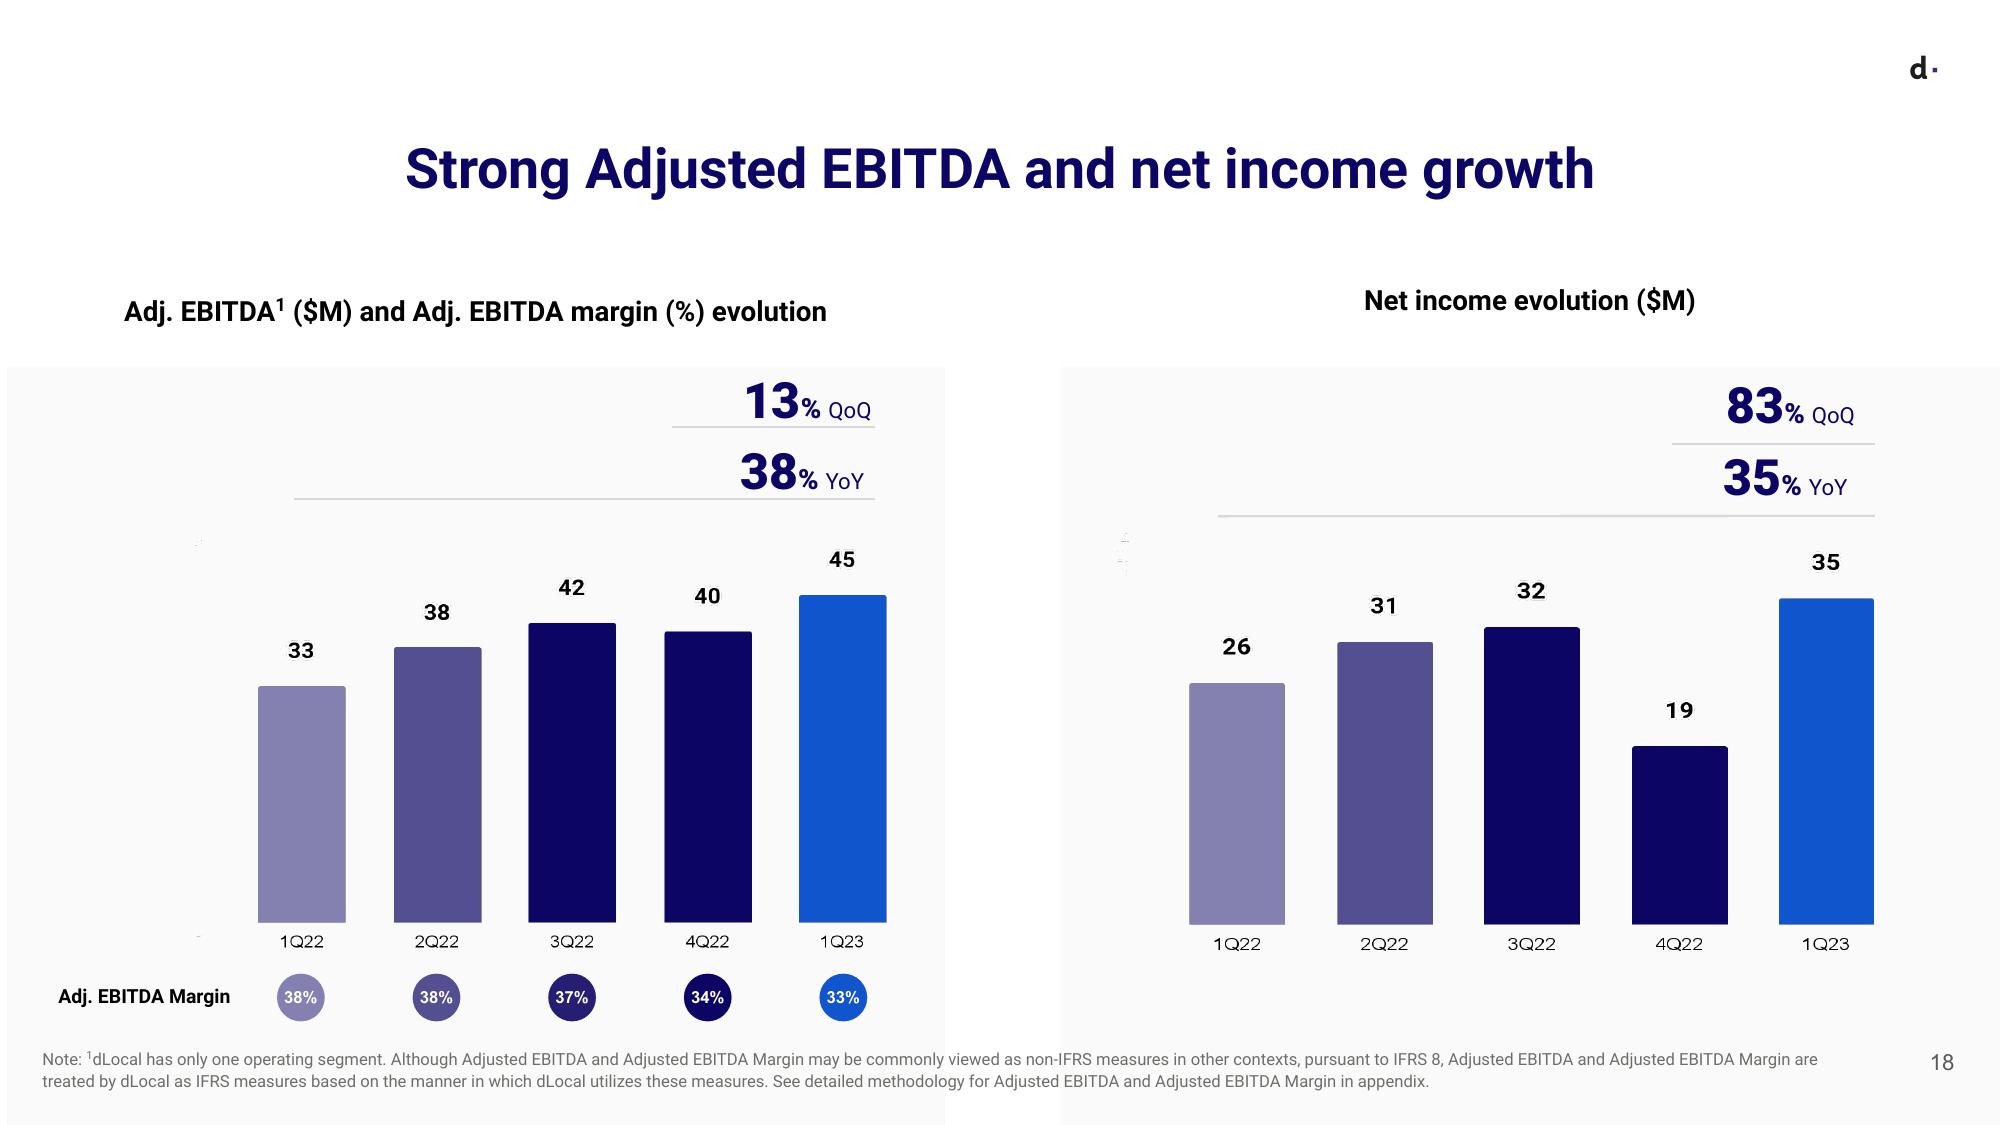
Adj. EBITDA¹ ($M) and Adj. EBITDA margin (%) evolution Adj. EBITDA Margin 33 1Q22 Strong Adjusted EBITDA and net income growth 38% 38 2Q22 38% 42 3Q22 37% 40 4Q22 34% 13% QOQ 38% YOY 45 1Q23 33% 26 1Q22 Net income evolution ($M) 31 2Q22 32 3Q22 19 4Q22 83% QOQ 35% YOY 35 1Q23 Note: ¹dLocal has only one operating segment. Although Adjusted EBITDA and Adjusted EBITDA Margin may be commonly viewed as non-IFRS measures in other contexts, pursuant to IFRS 8, Adjusted EBITDA and Adjusted EBITDA Margin are treated by dLocal as IFRS measures based on the manner in which dLocal utilizes these measures. See detailed methodology for Adjusted EBITDA and Adjusted EBITDA Margin in appendix. d. 18
View entire presentation