Evercore Investment Banking Pitch Book
Discussion Materials
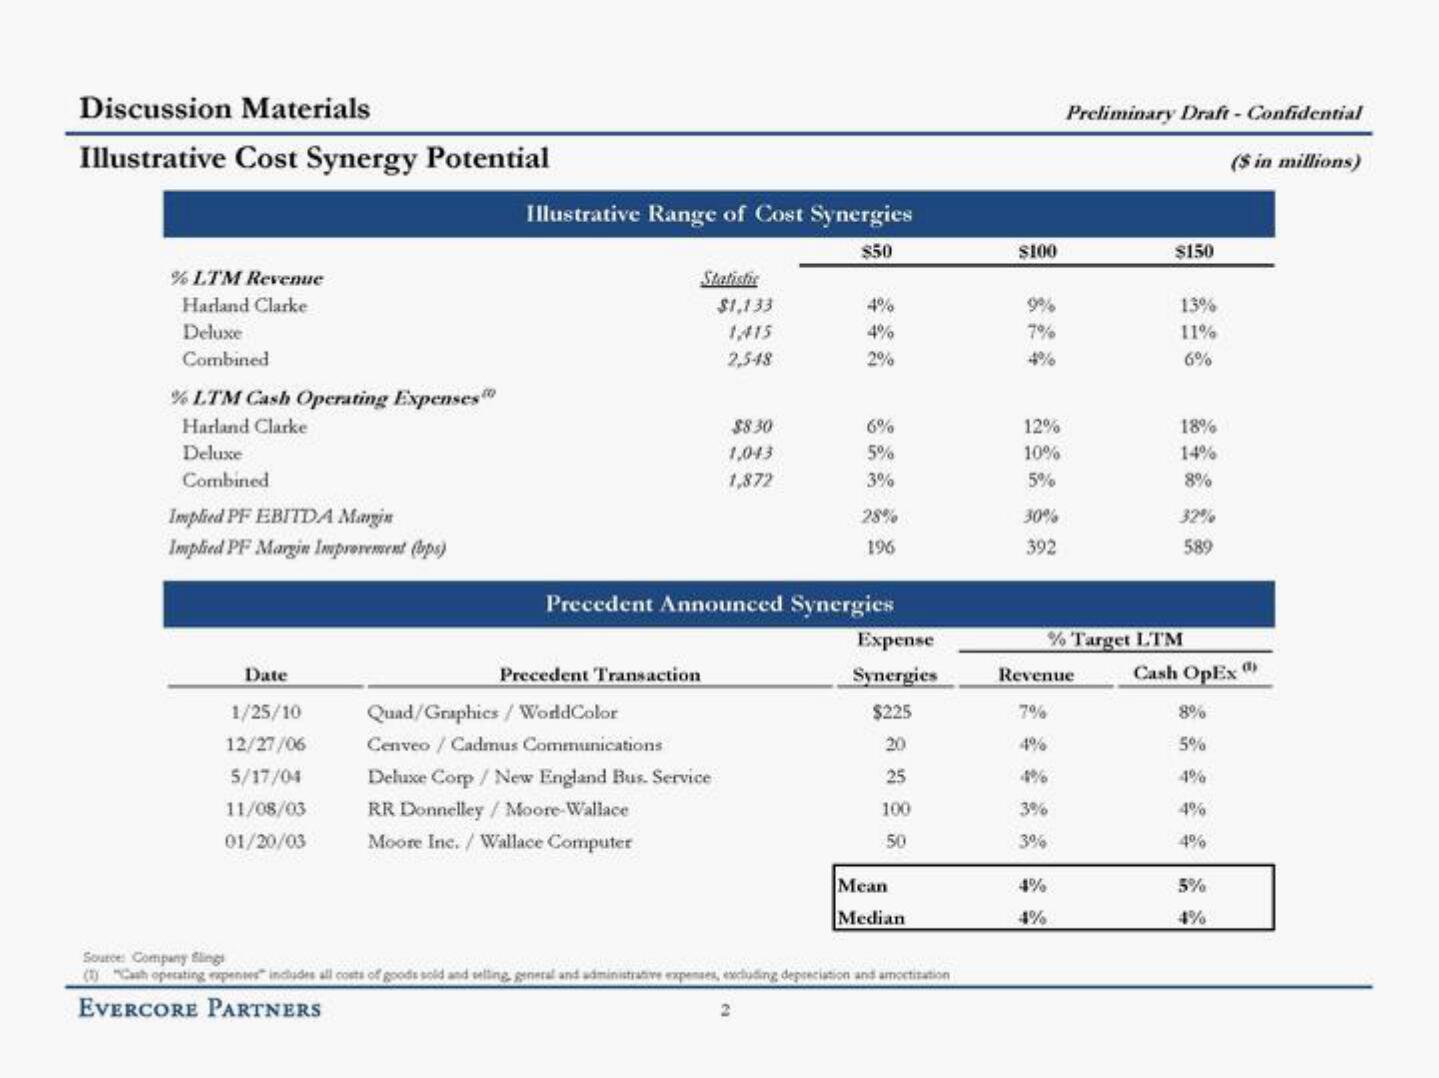
Illustrative Cost Synergy Potential
% LTM Revenue
Harland Clarke
Deluxe
Combined
% LTM Cash Operating Expenses
Harland Clarke
Deluxe
Combined
Implied PF EBITDA Margin
Implied PF Margin Improvement (bps)
Date
1/25/10
12/27/06
5/17/04
11/08/03
01/20/03
Illustrative Range of Cost Synergies
$50
Statistic
Precedent Transaction
$1,133
1,415
2,548
Quad/Graphics / WorldColor
Cenveo / Cadmus Communications
Deluxe Corp / New England Bus. Service
RR Donnelley/Moore Wallace
Moore Inc./ Wallace Computer
$8.30
1,043
1,872
4%
4%
2%
Precedent Announced Synergies
6%
5%
3%
2
28%
196
Expense
Synergies
$225
20
25
100
50
Mean
Median
Source: Company Slings
(1) Cash operating expenses includes all costs of goods sold and selling general and administrative expenses, excluding depreciation and amortization
EVERCORE PARTNERS
$100
9%
7%
12%
10%
5%
30%
392
7%
4%
4%
3%
3%
Preliminary Draft - Confidential
($ in millions)
Revenue
4%
4%
$150
13%
11%
6%
18%
14%
8%
32%
589
% Target LTM
Cash OpEx
8%
5%
4%
4%
4%
5%
4%
(1)View entire presentation