Commercial Metals Company Investor Presentation Deck
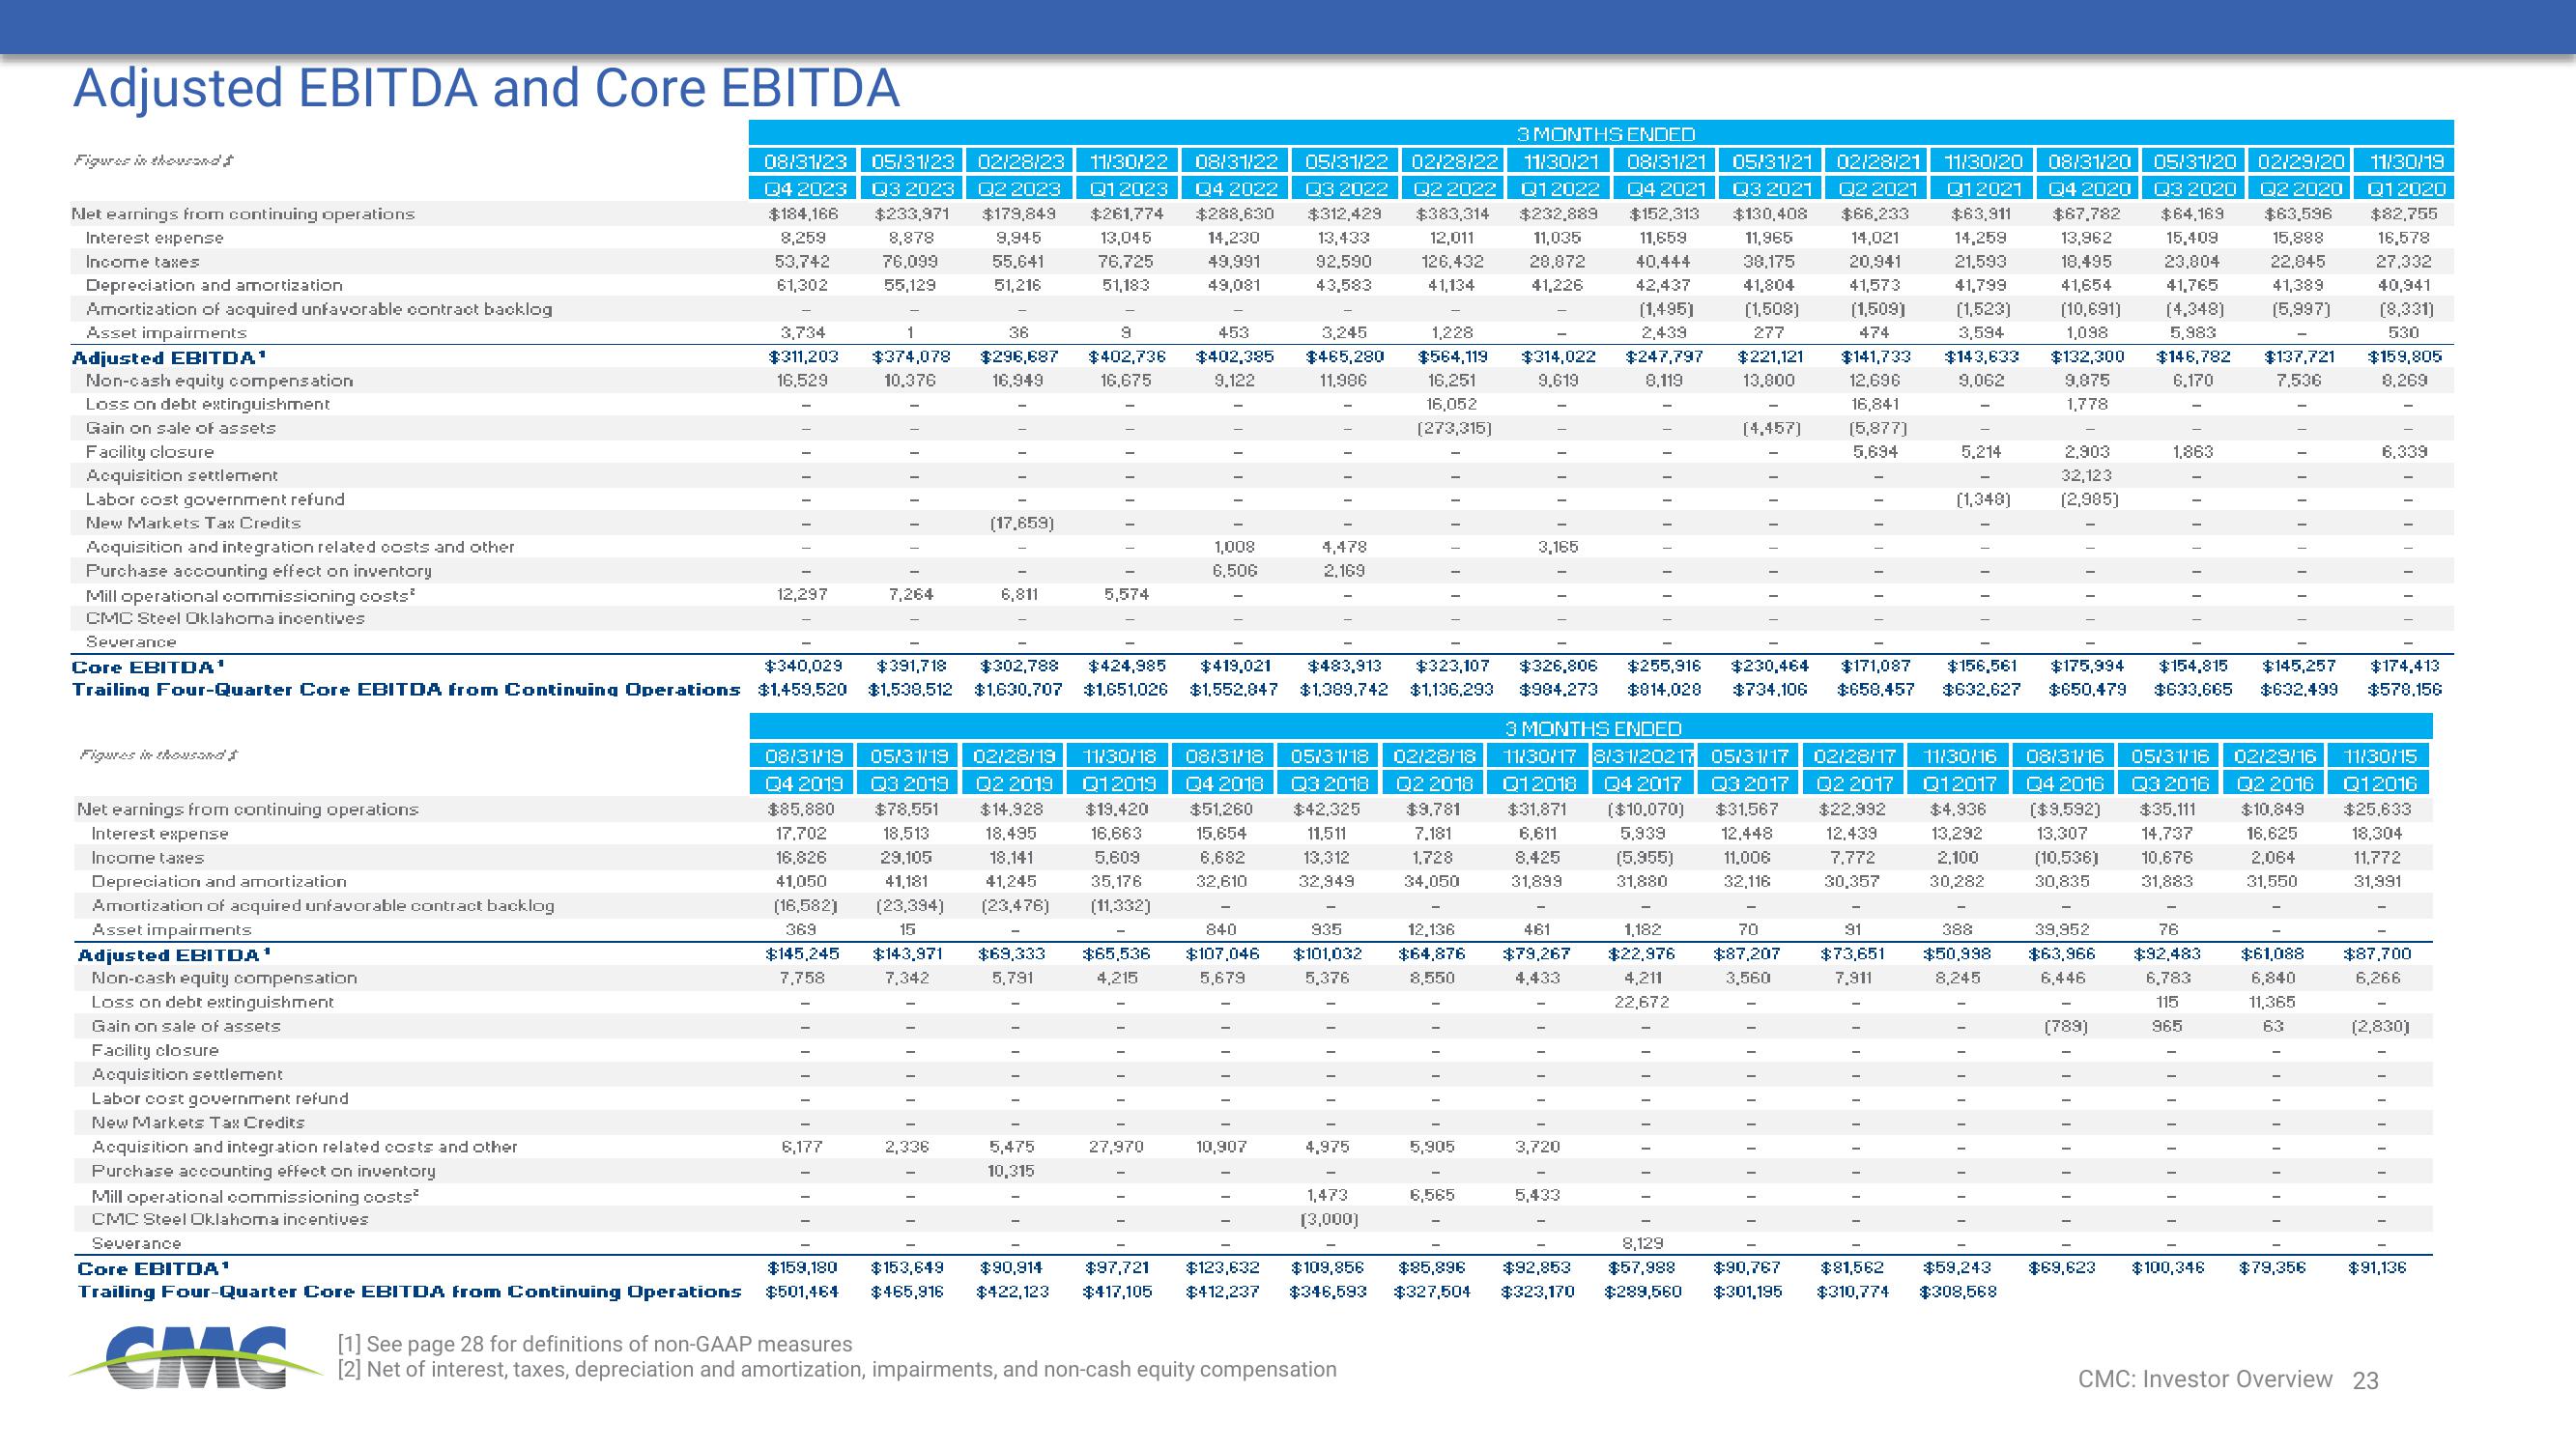
Adjusted EBITDA and Core EBITDA
Figures in thousand &
Net earnings from continuing operations
Interest expense
Income taxes
Depreciation and amortization
Amortization of acquired unfavorable contract backlog
Asset impairments
Adjusted EBITDA¹
Non-cash equity compensation
Loss on debt extinguishment
Gain on sale of assets
Facility closure
Acquisition settlement
Labor cost government refund
New Markets Tax Credits
Acquisition and integration related costs and other
Purchase accounting effect on inventory
Mill operational commissioning costs
CMC Steel Oklahoma incentives
Severance
Fligures in thousand J
Net earnings from continuing operations
Interest expense
Income taxes
Depreciation and amortization
Amortization of acquired unfavorable contract backlog
Asset impairments
Adjusted EBITDA ¹
Non-cash equity compensation
Core EBITDA¹
Trailing Four-Quarter Core EBITDA from Continuing Operations $1,459,520
Loss on debt extinguishment
Gain on sale of assets
Facility closure
Acquisition settlement
Labor cost government refund
New Markets Tax Credits
08/31/23 05/31/23 02/28/23
Q2 2023
$179,849
9,945
55,641
51,216
Acquisition and integration related costs and other
Purchase accounting effect on inventory
Mill operational commissioning costs²
CMC Steel Oklahoma incentives
Severance
Q4 2023
$184,166
8,259
53,742
61,302
3,734
$311,203
16,529
|
12,297
Q3 2023
$233,971
8,878
76,099
55,129
$145,245
7,758
1
$374,078
10.376
6,177
7,264
36
$296,687
16,949
||||II
(17,659)
2,336
6,811
$340,029 $391,718 $302,788 $424,985 $419,021
$1,538,512 $1,630,707 $1,651,026 $1,552,847
11/30/22
Q12023
$261,774
13,045
76,725
51,183
9
$402,736
16,675
TITIN
5,574
08/31/19 05/31/19
Q4 2019
$85,880
Q3 2019
$78,551
18.513
17,702
16,826
29,105
41,050
(16,582)
369
41,181
(23,394)
15
840
$143,971 $69,333 $65,536 $107,046
7,342
4,215
5,791
5,679
5,475
10,315
08/31/22 05/31/22 02/28/22
Q4 2022 Q3 2022 Q2 2022
$288,630 $312,429 $383,314
14,230
13,433
12,011
49,991
92,590 126,432
49,081 43,583
41,134
453
$402,385
9.122
02/28/19
Q2 2019
$14.928
11/30/18 08/31/18
Q12019 Q4 2018
$19.420 $51,260
15,654
18,495
16,663
18,141
5,609
6,682
41,245
32,610
35,176
(23,476) (11,332)
1,008
6,506
27,970
TIT
10,907
Core EBITDA¹
$159,180 $153,649
$90,914
$97,721 $123,632
Trailing Four-Quarter Core EBITDA from Continuing Operations $501,464 $465,916 $422,123 $417,105 $412,237
3,245
$465,280
11,986
4,478
2,169
05/31/18 02/28/18
Q3 2018 Q2 2018
$42.325 $9,781
11,511
7.181
1,728
13.312
32,949
34,050
935
$101,032
5,376
TIT
4,975
$483,913 $323,107 $326,806 $255,916 $230,464
$1,389,742 $1,136,293 $984.273 $814,028 $734,106
1,473
(3,000)
1,228
$564,119 $314,022
16,251
9,619
16,052
(273,315)
[1] See page 28 for definitions of non-GAAP measures
[2] Net of interest, taxes, depreciation and amortization, impairments, and non-cash equity compensation
3 MONTHS ENDED
11/30/21 08/31/21 05/31/21
Q12022 Q4 2021 Q3 2021
$232,889 $152,313 $130,408
11,035
11,659
11,965
28,872
40.444 38,175
41,226
42,437
41,804
(1,495) (1,508)
2,439
277
$247,797 $221,121
8,119
13,800
5,905
3,165
6,565
12,136
461
$64,876 $79,267
8,550
4,433
3 MONTHS ENDED
11/30/17 8/31/20217 05/31/17
Q12018 Q4 2017 Q3 2017
$31,871 ($10,070) $31,567
6,611
5,939
12.448
8.425
(5.955) 11,006
31,899
31,880
32,116
III
3,720
III||
5,433
(4,457)
III
1,182
70
$22,976 $87,207
4,211
3,560
22,672
|||||II
02/28/21
Q2 2021 Q12021
$66,233 $63,911
14,021
14,259
20,941
21.593
41,573
41,799
(1,509) (1,523)
474
3,594
$141,733 $143,633
12,696
9,062
16,841
(5,877)
5,694
11/30/20 08/31/20 05/31/20 02/29/20 11/30/19
Q4 2020 Q3 2020 Q2 2020 Q12020
$67,782 $64,169 $63,596 $82,755
13,962
15,409
15,888 16,578
18,495
23,804
22.845 27.332
41,654 41,765
41,389
(10,691) (4,348) (5,997)
1,098
5,983
$132,300 $146,782 $137,721
9,875
6.170
7.536
1,778
40,941
(8,331)
530
$159,805
8,269
91
$73,651
7,911
5.214
||||||
(1,348)
02/28/17 11/30/16 08/31/16 05/31/16
Q2 2017 Q12017 Q4 2016 Q3 2016
$22.992 $4.936 ($9.592) $35.111
12.439
13,292
13.307 14,737
7.772
2,100 (10,536) 10,676
30,357 30,282 30,835 31,883
2.903
32,123
(2,985)
388
$50,998
8,245
8,129
$109,856 $85,896 $92,853 $57,988 $90,767 $81,562 $59,243
$346,593 $327,504 $323,170 $289,560 $301,195 $310,774 $308,568
$171,087 $156,561 $175,994 $154,815 $145,257 $174,413
$658,457 $632,627 $650,479 $633.665 $632,499 $578,156
1,863
(789)
IIIIIIII
$69,623
39,952
76
$63,966 $92,483 $61,088
6,446
6,783
6,840
115
11,365
965
63
IIIIII
|||||
Q2 2016
$10,849
16,625
2,064
31,550
02/29/16 11/30/15
Q12016
$25,633
18.304
11.772
31,991
|||||
6.339
$100,346 $79,356
|||||||
$87,700
6,266
(2,830)
IIIIIII
CMC: Investor Overview 23
$91,136View entire presentation