Benson Hill Results Presentation Deck
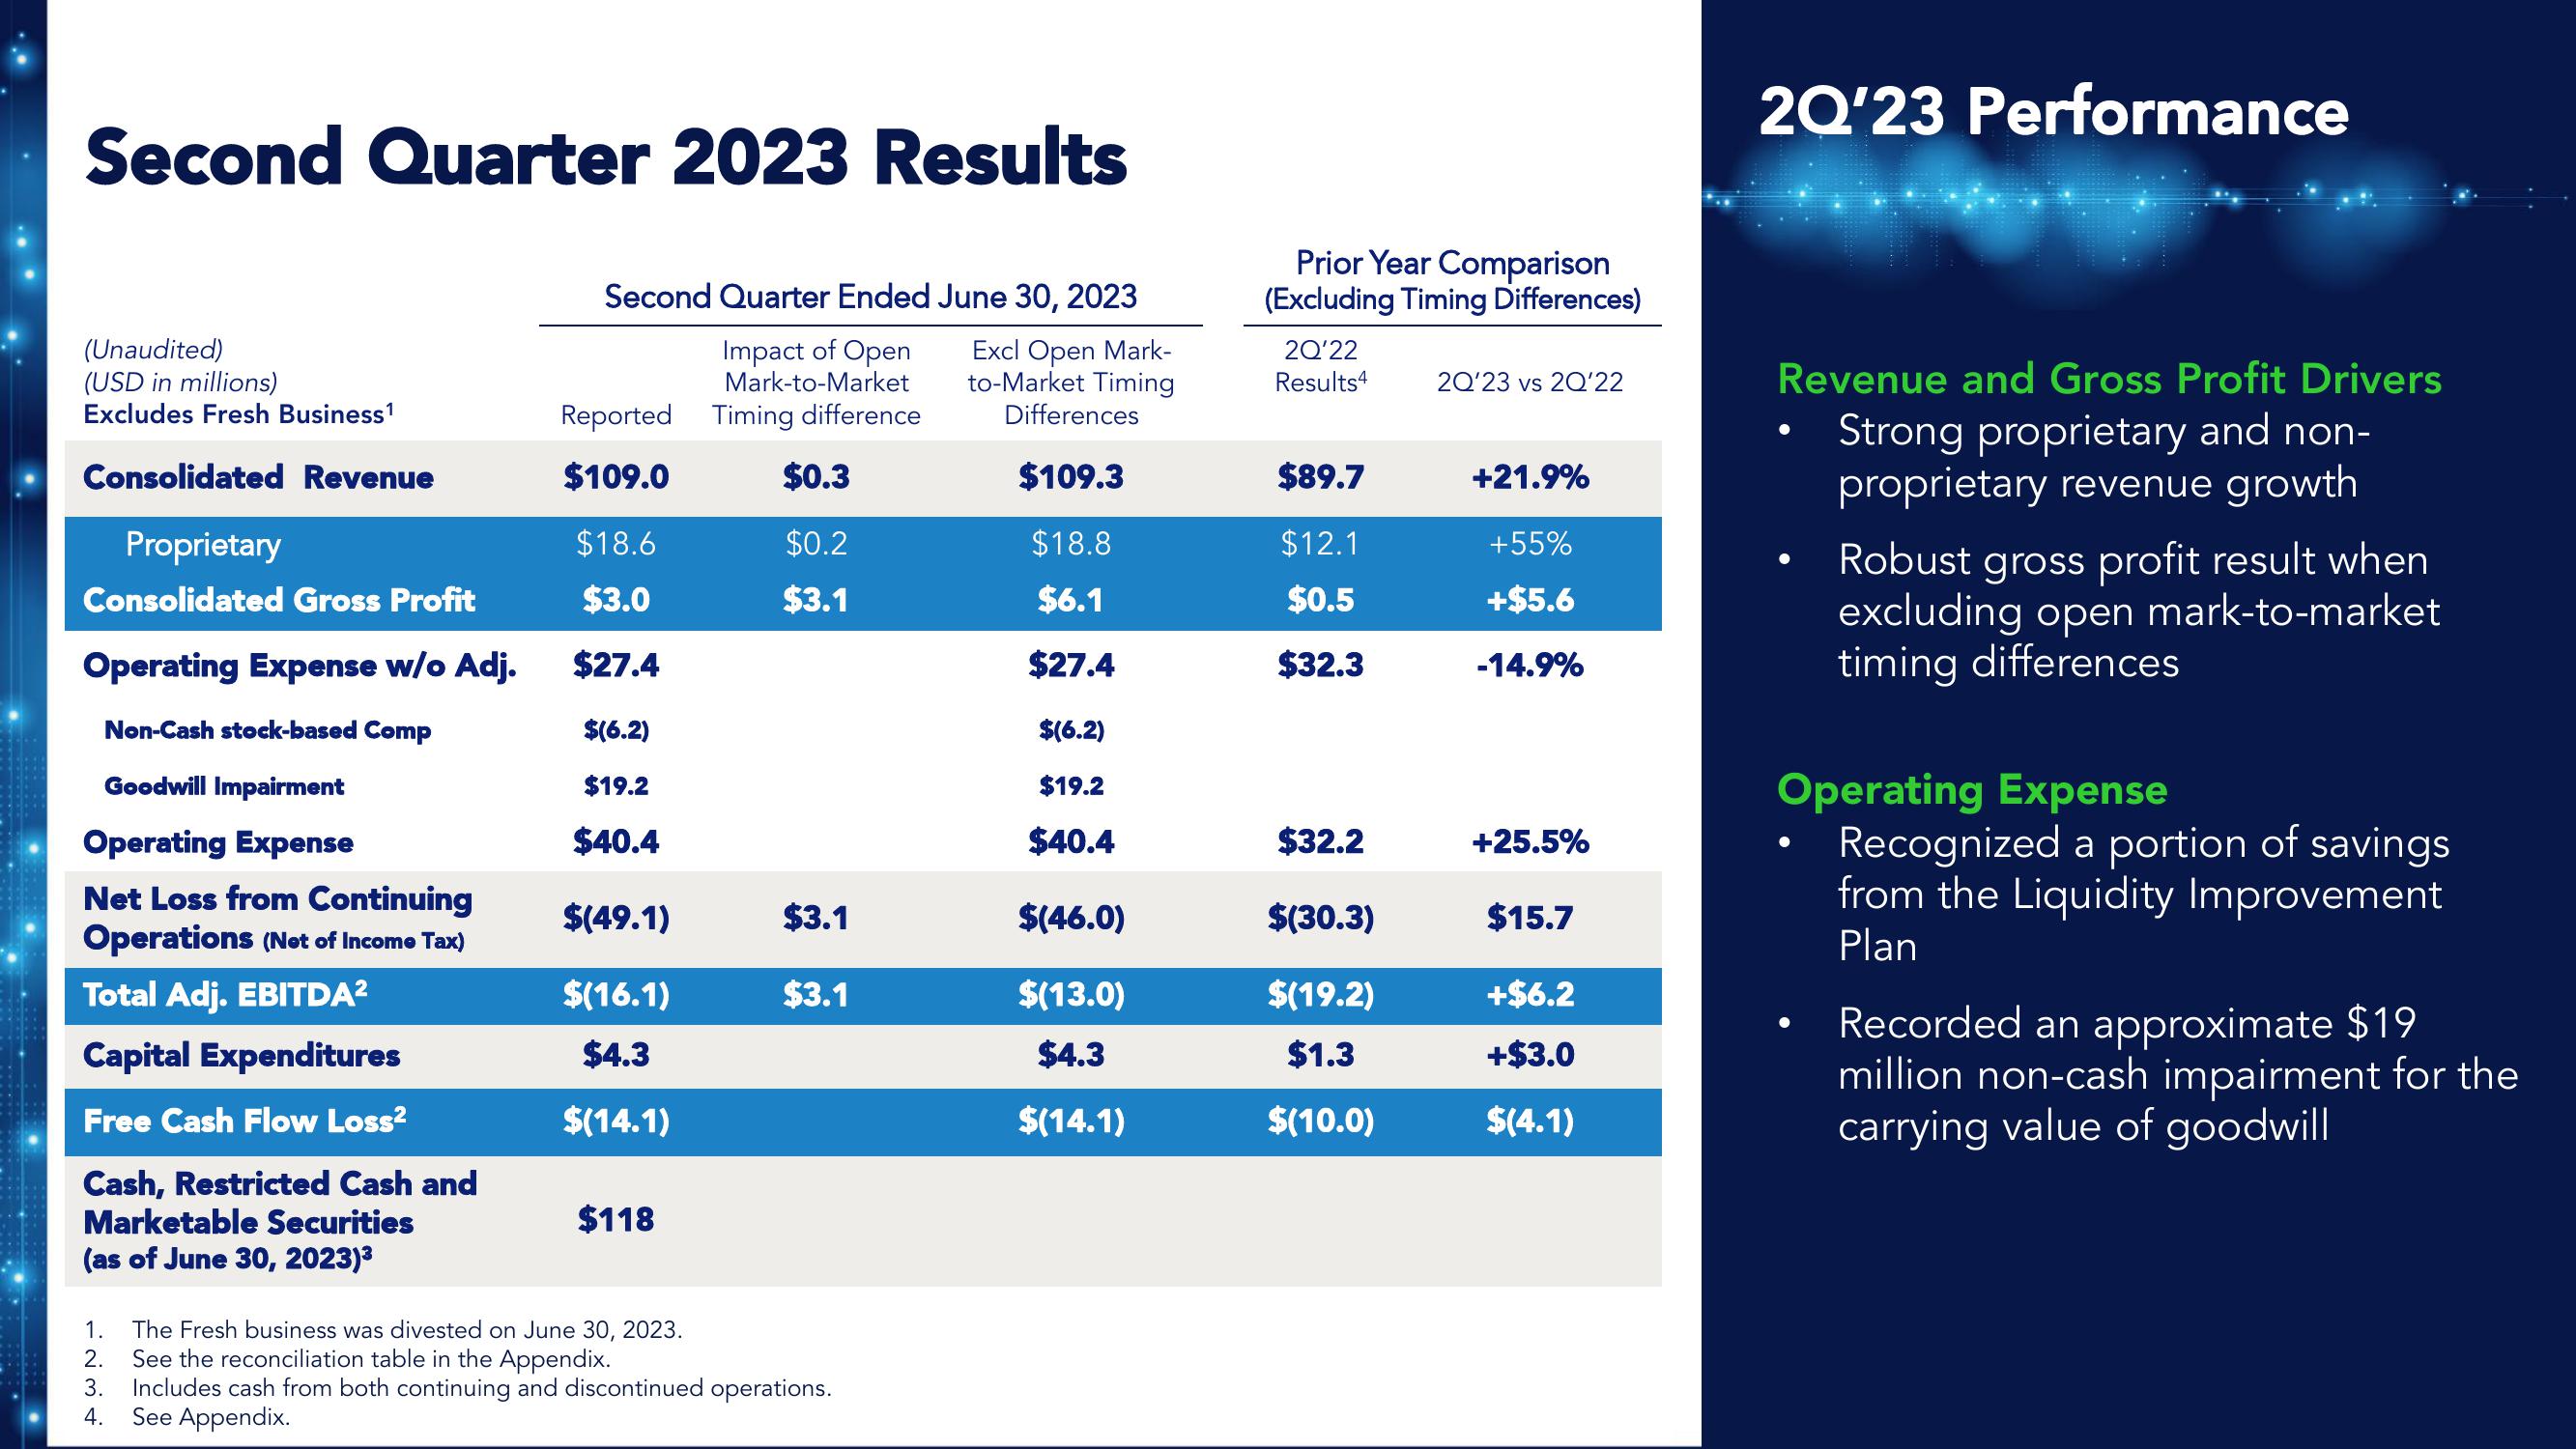
Second Quarter 2023 Results
(Unaudited)
(USD in millions)
Excludes Fresh Business¹1
Consolidated Revenue
Proprietary
Consolidated Gross Profit
Operating Expense w/o Adj.
Non-Cash stock-based Comp
Goodwill Impairment
Operating Expense
Net Loss from Continuing
Operations (Not of Income Tax)
Total Adj. EBITDA²
Capital Expenditures
Free Cash Flow Loss²
Cash, Restricted Cash and
Marketable Securities
(as of June 30, 2023)³
Second Quarter Ended June 30, 2023
Impact of Open
Mark-to-Market
Reported Timing difference
$109.0
$18.6
$3.0
$27.4
$(6.2)
$19.2
$40.4
$(49.1)
$(16.1)
$4.3
$(14.1)
$118
$0.3
$0.2
$3.1
$3.1
$3.1
1. The Fresh business was divested on June 30, 2023.
2. See the reconciliation table in the Appendix.
3. Includes cash from both continuing and discontinued operations.
4.
See Appendix.
Excl Open Mark-
to-Market Timing
Differences
$109.3
$18.8
$6.1
$27.4
$(6.2)
$19.2
$40.4
$(46.0)
$(13.0)
$4.3
$(14.1)
Prior Year Comparison
(Excluding Timing Differences)
2Q'22
Results 4
$89.7
$12.1
$0.5
$32.3
$32.2
$(30.3)
$(19.2)
$1.3
$(10.0)
20'23 vs 20'22
+21.9%
+55%
+$5.6
-14.9%
+25.5%
$15.7
+$6.2
+$3.0
$(4.1)
2Q'23 Performance
Revenue and Gross Profit Drivers
Strong proprietary and non-
proprietary revenue growth
Robust gross profit result when
excluding open mark-to-market
timing differences
Operating Expense
Recognized a portion of savings
from the Liquidity Improvement
Plan
Recorded an approximate $19
million non-cash impairment for the
carrying value of goodwillView entire presentation