Benson Hill Results Presentation Deck
BENSON HILL
Non-GAAP Reconciliation¹
BENSON HILL
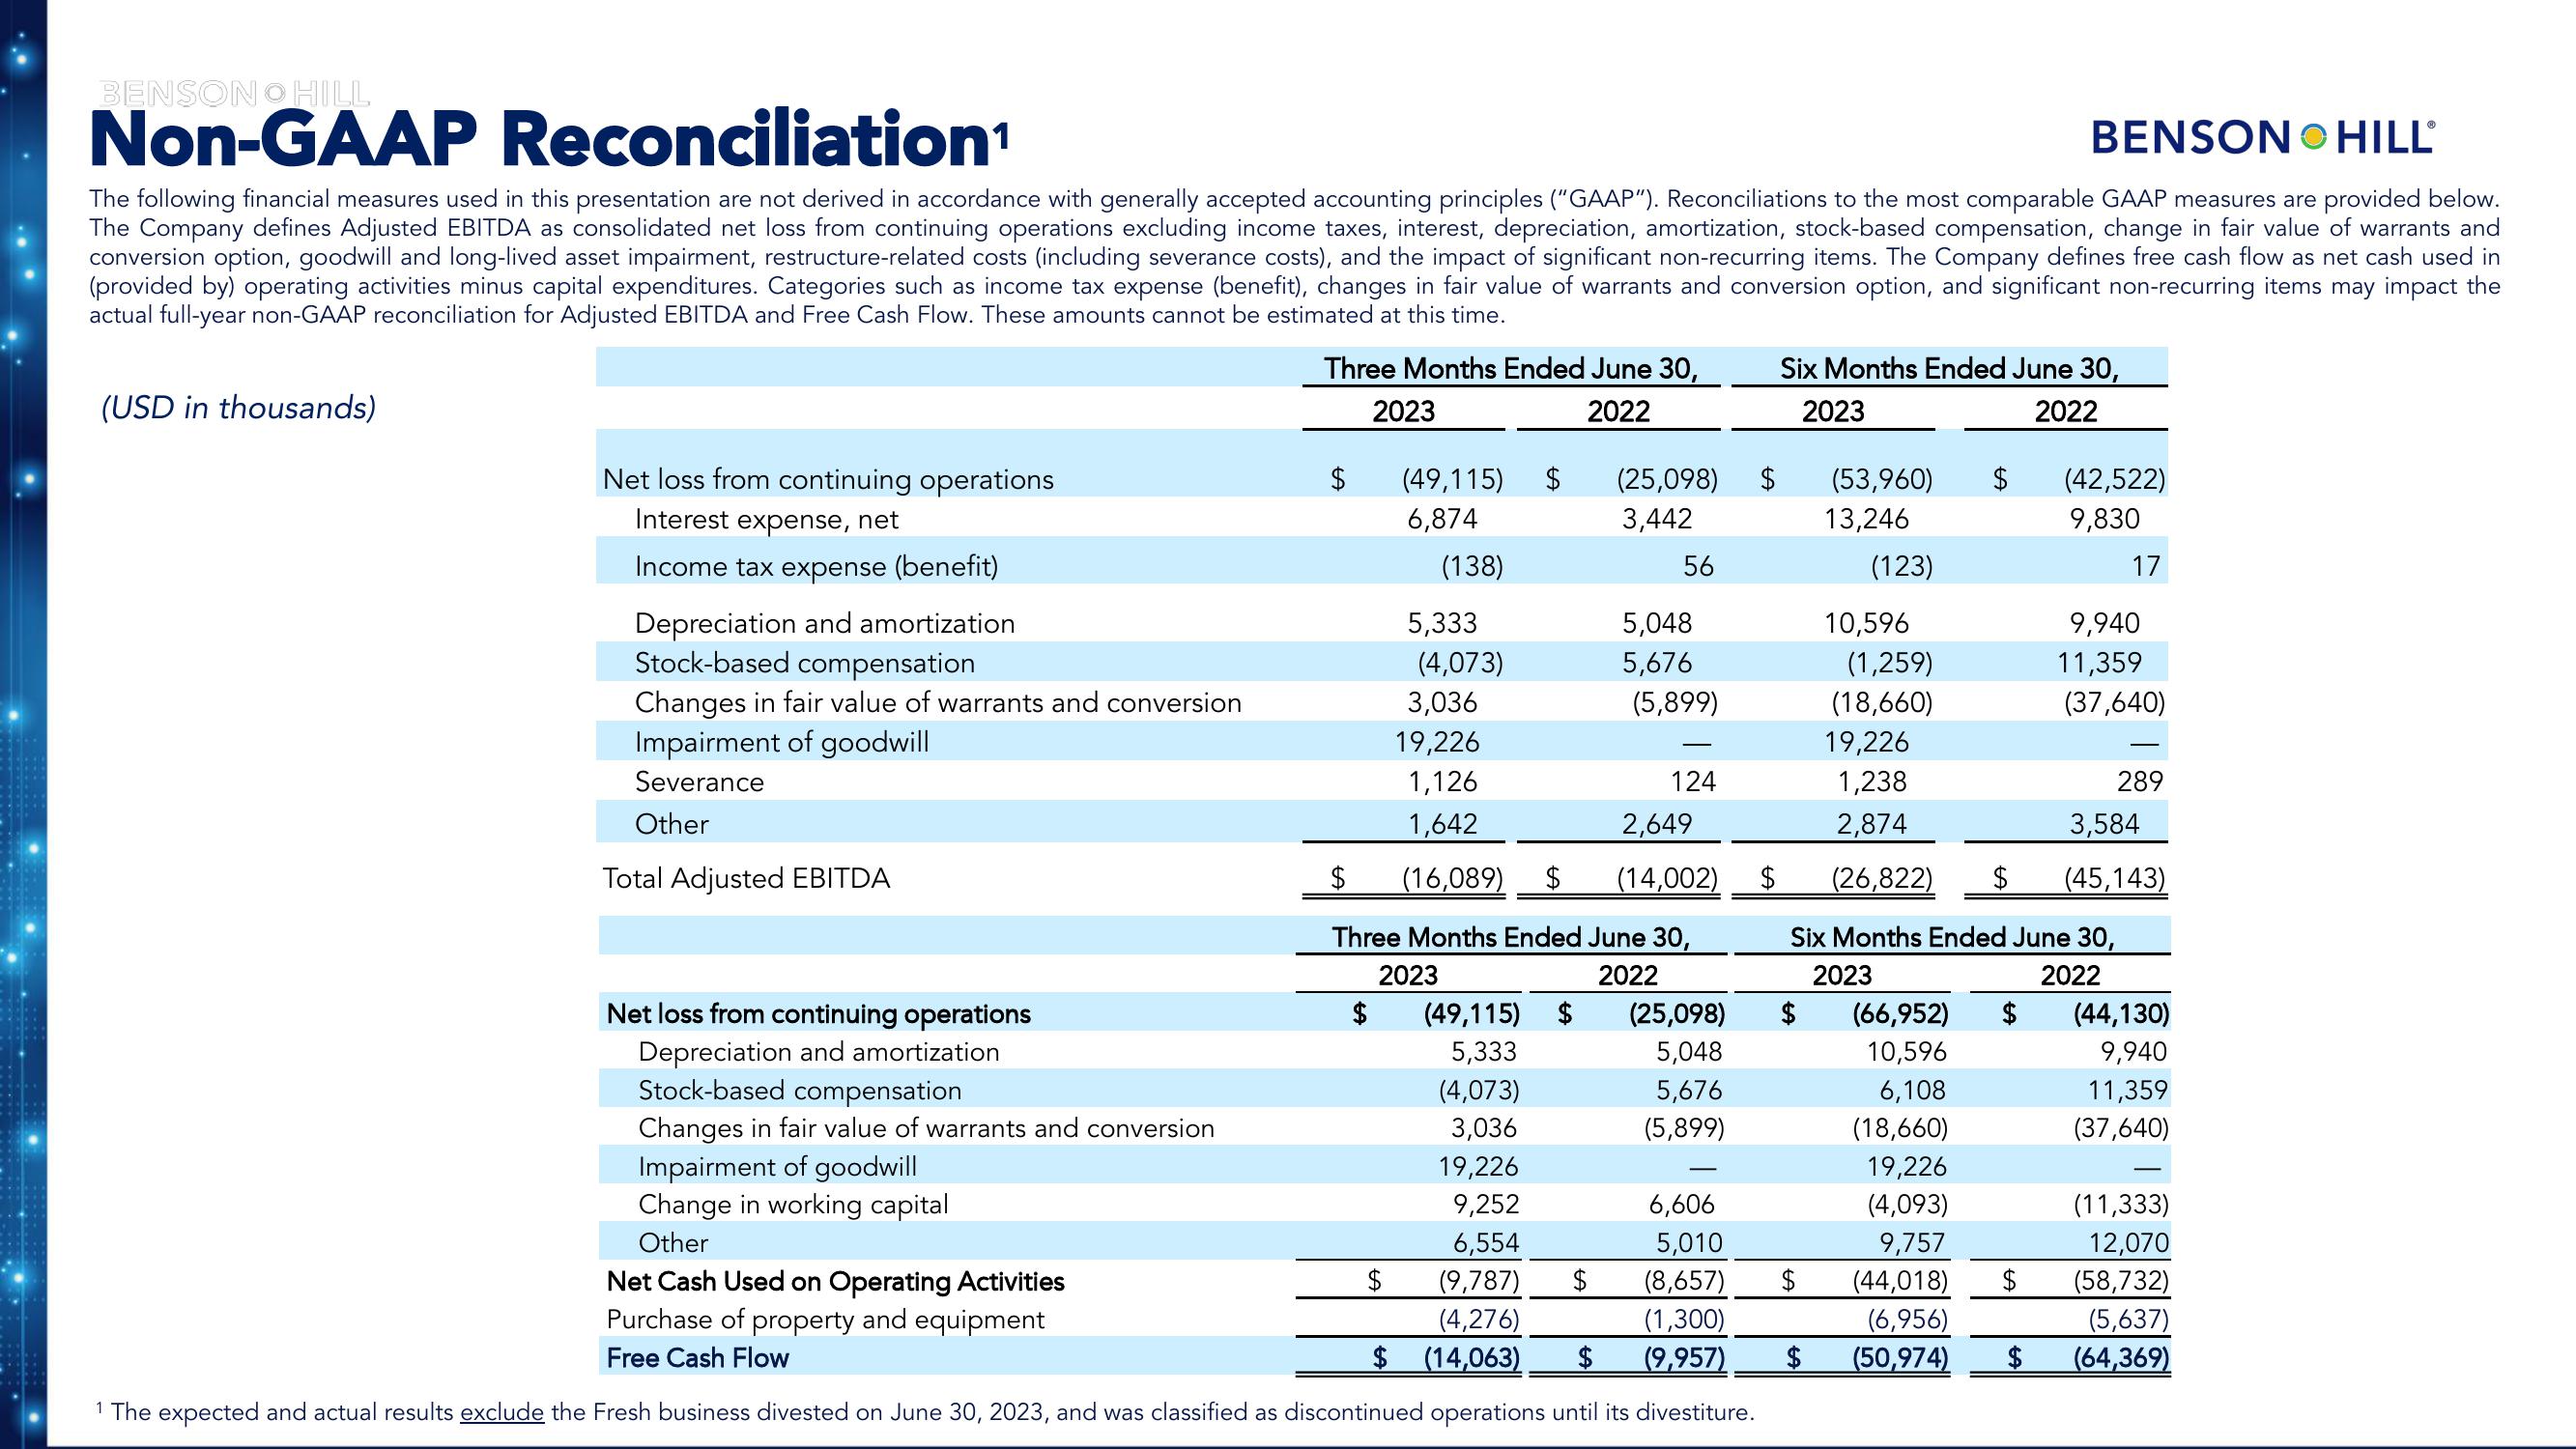
The following financial measures used in this presentation are not derived in accordance with generally accepted accounting principles ("GAAP"). Reconciliations to the most comparable GAAP measures are provided below.
The Company defines Adjusted EBITDA as consolidated net loss from continuing operations excluding income taxes, interest, depreciation, amortization, stock-based compensation, change in fair value of warrants and
conversion option, goodwill and long-lived asset impairment, restructure-related costs (including severance costs), and the impact of significant non-recurring items. The Company defines free cash flow as net cash used in
(provided by) operating activities minus capital expenditures. Categories such as income tax expense (benefit), changes in fair value of warrants and conversion option, and significant non-recurring items may impact the
actual full-year non-GAAP reconciliation for Adjusted EBITDA and Free Cash Flow. These amounts cannot be estimated at this time.
(USD in thousands)
Net loss from continuing operations
Interest expense, net
Income tax expense (benefit)
Depreciation and amortization
Stock-based compensation
Changes in fair value of warrants and conversion
Impairment of goodwill
Severance
Other
Total Adjusted EBITDA
Three Months Ended June 30,
2023
2022
Net loss from continuing operations
Depreciation and amortization
Stock-based compensation
$
(49,115) $ (25,098)
6,874
3,442
(138)
5,333
(4,073)
56
5,048
5,676
3,036
19,226
1,126
124
1,642
$
2,649
(16,089) $ (14,002)
Three Months Ended June 30,
2023
2022
$
(5,899)
(49,115) $
5,333
(4,073)
Changes in fair value of warrants and conversion
3,036
Impairment of goodwill
19,226
Change in working capital
9,252
6,606
Other
6,554
5,010
(9,787)
(8,657)
Net Cash Used on Operating Activities
Purchase of property and equipment
Free Cash Flow
(4,276)
(1,300)
$ (14,063)
$
(9,957)
1 The expected and actual results exclude the Fresh business divested on June 30, 2023, and was classified as discontinued operations until its divestiture.
(25,098)
5,048
5,676
(5,899)
$
$
Six Months Ended June 30,
2023
2022
$
(53,960) $
13,246
(123)
$
10,596
(1,259)
(18,660)
19,226
1,238
2,874
289
3,584
(26,822) $ (45,143)
Six Months Ended June 30,
2023
2022
(66,952) $
10,596
6,108
(18,660)
19,226
(4,093)
9,757
(44,018)
(6,956)
(50,974)
(42,522)
9,830
17
$
9,940
11,359
(37,640)
(44,130)
9,940
11,359
(37,640)
(11,333)
12,070
(58,732)
(5,637)
(64,369)View entire presentation