Amplitude Results Presentation Deck
A
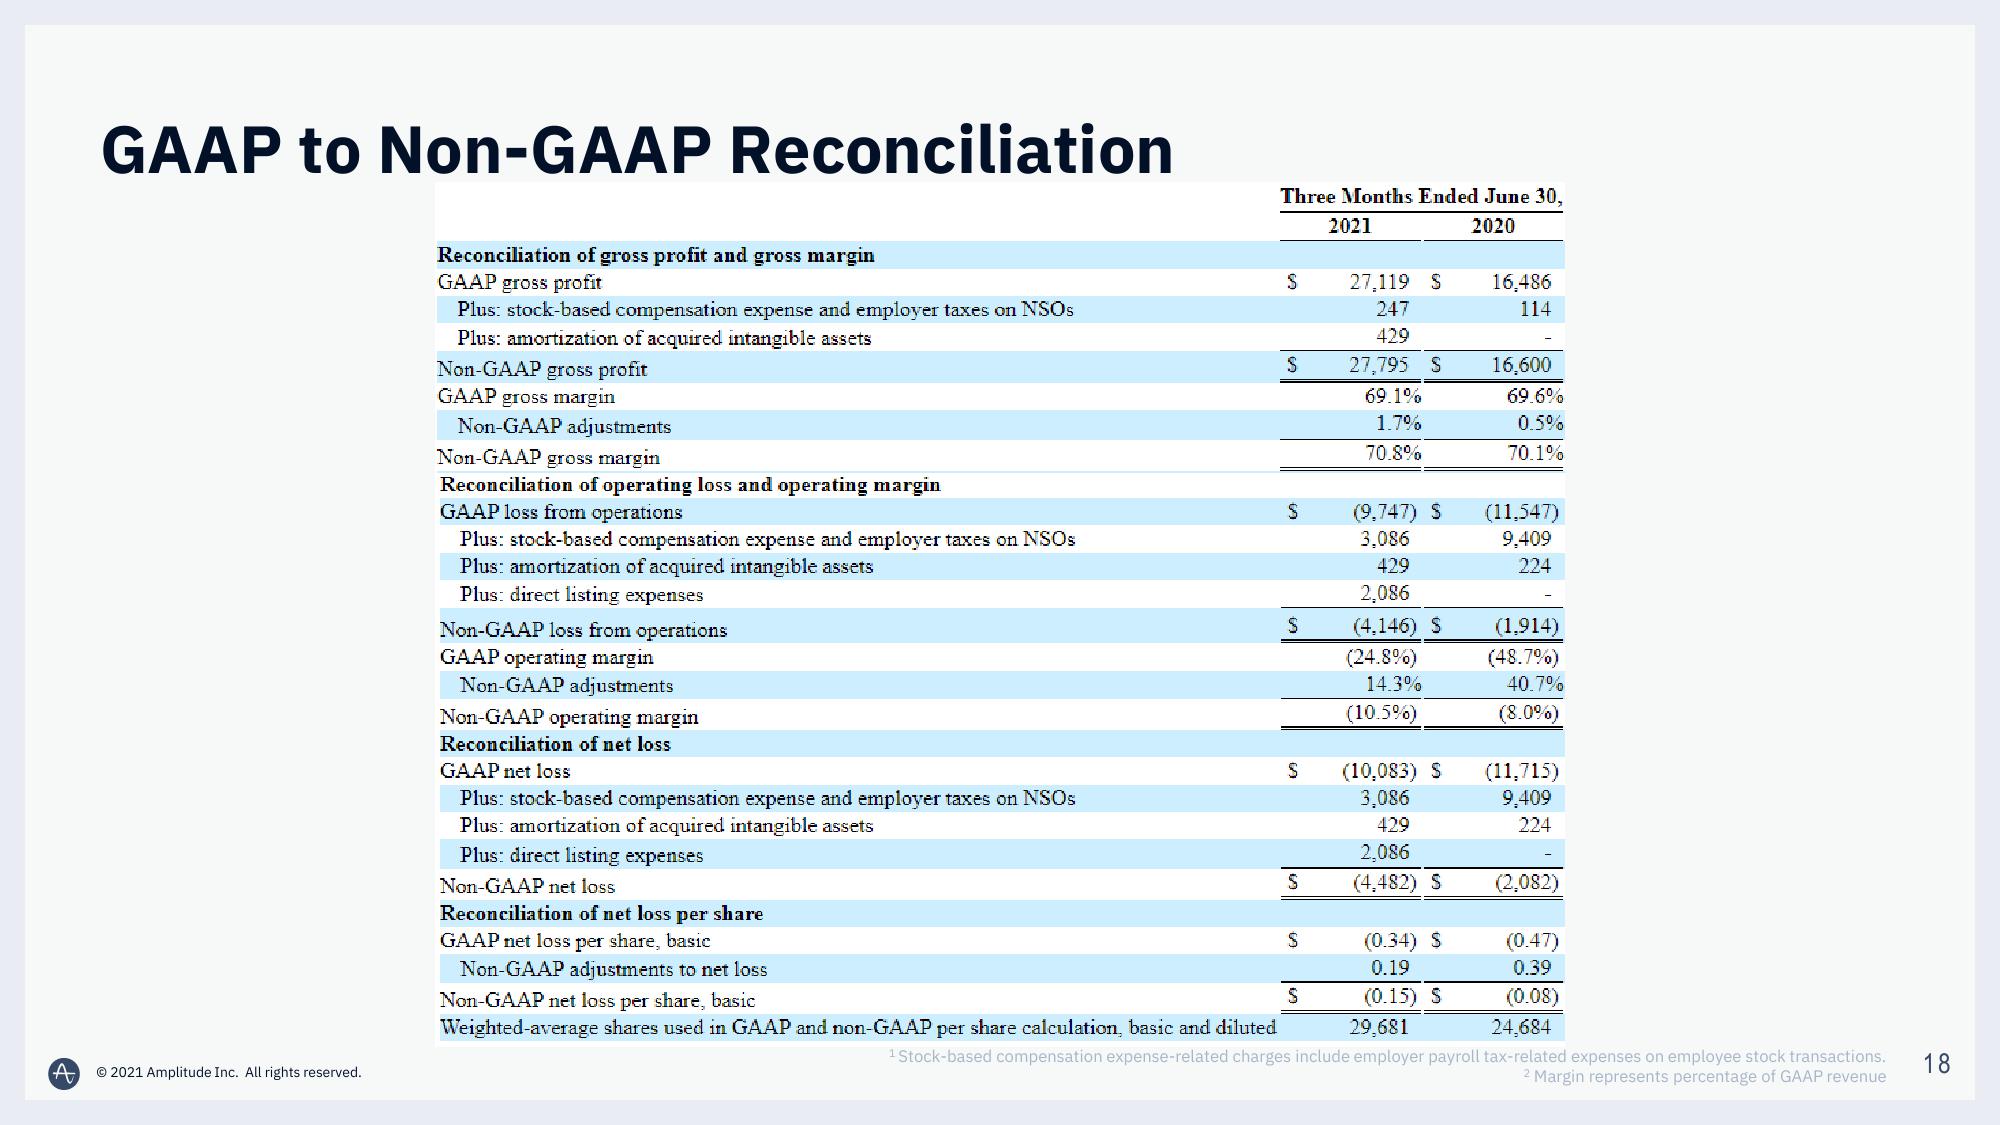
GAAP to Non-GAAP Reconciliation
Reconciliation of gross profit and gross margin
GAAP gross profit
© 2021 Amplitude Inc. All rights reserved.
Plus: stock-based compensation expense and employer taxes on NSOS
Plus: amortization of acquired intangible assets
Non-GAAP gross profit
GAAP gross margin
Non-GAAP adjustments
Non-GAAP gross margin
Reconciliation of operating loss and operating margin
GAAP loss from operations
Plus: stock-based compensation expense and employer taxes on NSOS
Plus: amortization of acquired intangible assets
Plus: direct listing expenses
Non-GAAP loss from operations
GAAP operating margin
Non-GAAP adjustments
Non-GAAP operating margin
Reconciliation of net loss
Three Months Ended June 30,
2021
2020
S
S
S
S
S
S
S
27.119 S
247
429
27,795 S
69.1%
1.7%
70.8%
S
(9,747) S
3,086
429
2,086
(4.146) S
(24.8%)
14.3%
(10.5%)
(10,083) S
3,086
429
2,086
(4,482) S
GAAP net loss
Plus: stock-based compensation expense and employer taxes on NSOs
Plus: amortization of acquired intangible assets
Plus: direct listing expenses
Non-GAAP net loss
Reconciliation of net loss per share
GAAP net loss per share, basic
Non-GAAP adjustments to net loss
Non-GAAP net loss per share, basic
29,681
24,684
Weighted-average shares used in GAAP and non-GAAP per share calculation, basic and diluted
¹ Stock-based compensation expense-related charges include employer payroll tax-related expenses on employee stock transactions.
2 Margin represents percentage of GAAP revenue
16,486
114
(0.34) $
0.19
(0.15) S
16,600
69.6%
0.5%
70.1%
(11,547)
9,409
224
(1.914)
(48.7%)
40.7%
(8.0%)
(11,715)
9,409
224
(2,082)
(0.47)
0.39
(0.08)
18View entire presentation