Fastly Investor Day Presentation Deck
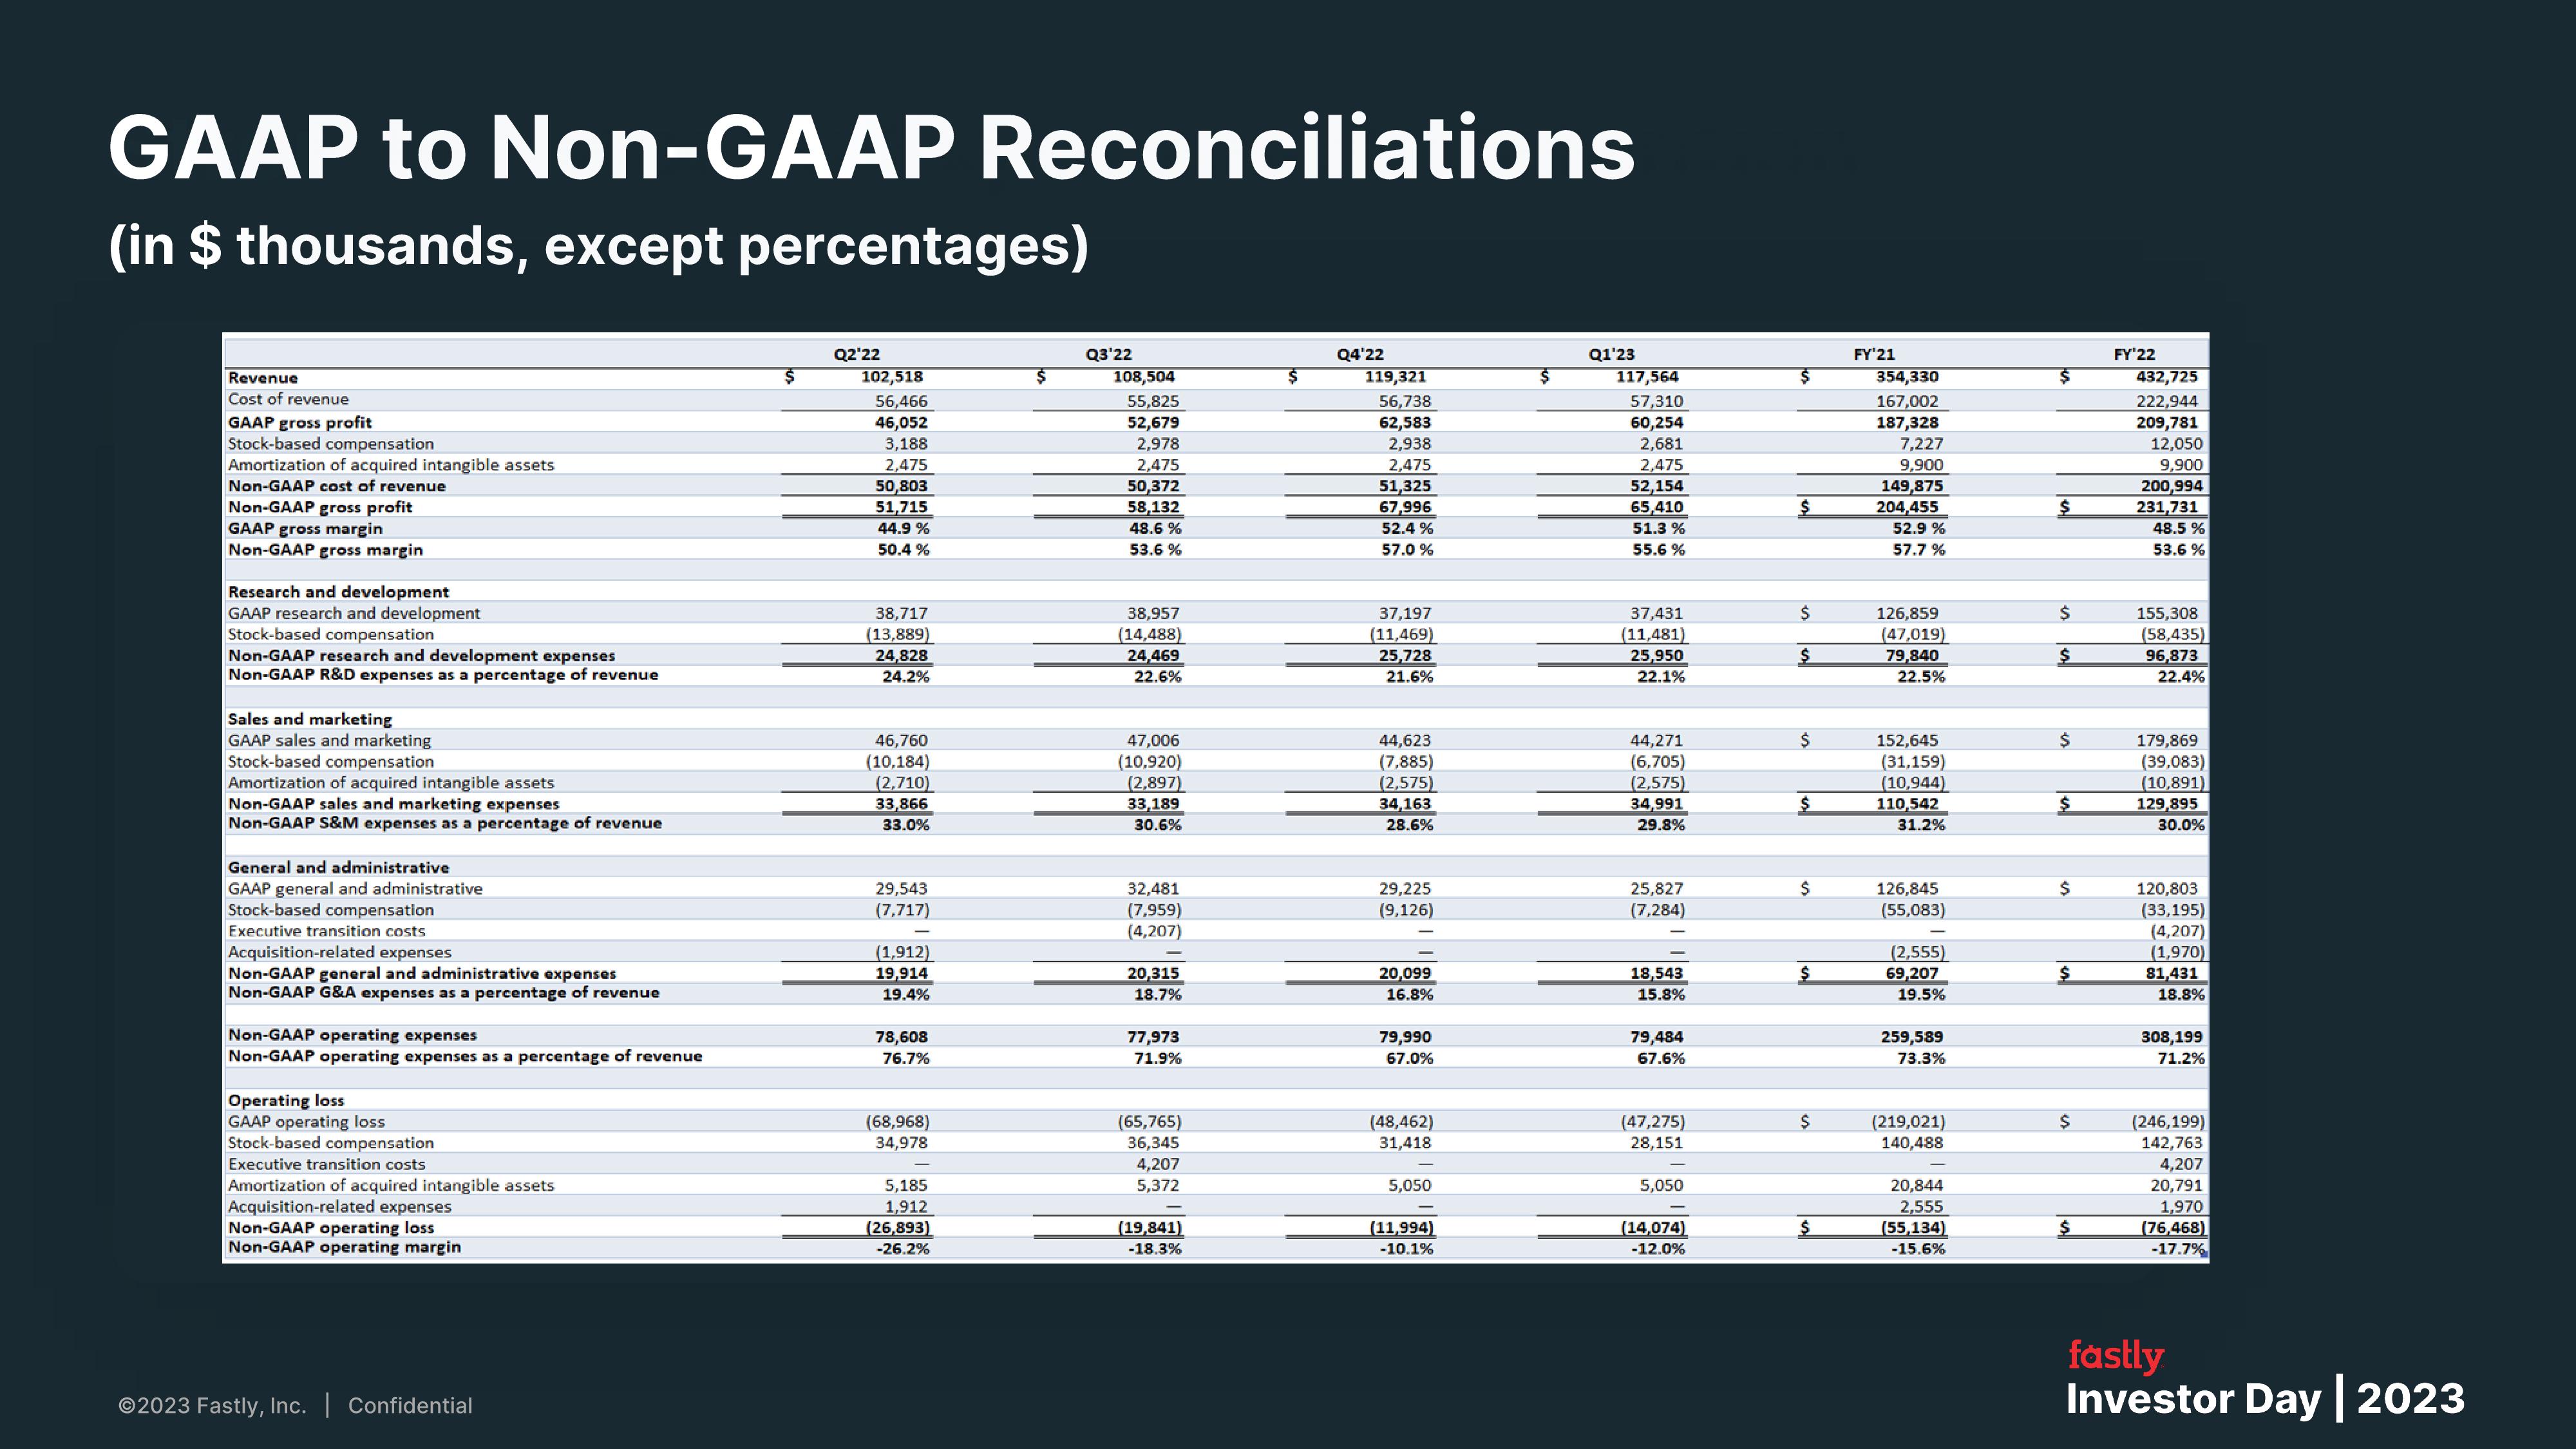
GAAP to Non-GAAP Reconciliations
(in $ thousands, except percentages)
Revenue
Cost of revenue
GAAP gross profit
Stock-based compensation
Amortization of acquired intangible assets
Non-GAAP cost of revenue
Non-GAAP gross profit
GAAP gross margin
Non-GAAP gross margin
Research and development
GAAP research and development
Stock-based compensation
Non-GAAP research and development expenses
Non-GAAP R&D expenses as a percentage of revenue
Sales and marketing
GAAP sales and marketing
Stock-based compensation
Amortization of acquired intangible assets
Non-GAAP sales and marketing expenses
Non-GAAP S&M expenses as a percentage of revenue
General and administrative
GAAP general and administrative
Stock-based compensation
Executive transition costs
Acquisition-related expenses
Non-GAAP general and administrative expenses
Non-GAAP G&A expenses as a percentage of revenue
Non-GAAP operating expenses
Non-GAAP operating expenses as a percentage of revenue
Operating loss
GAAP operating loss
Stock-based compensation
Executive transition costs
Amortization of acquired intangible assets
Acquisition-related expenses
Non-GAAP operating loss
Non-GAAP operating margin
Ⓒ2023 Fastly, Inc. | Confidential
Q2'22
102,518
56,466
46,052
3,188
2,475
50,803
51,715
44.9 %
50.4 %
38,717
(13,889)
24,828
24.2%
46,760
(10,184)
(2,710)
33,866
33.0%
29,543
(7,717)
(1,912)
19,914
19.4%
78,608
76.7%
(68,968)
34,978
5,185
1,912
(26,893)
-26.2%
Q3'22
108,504
55,825
52,679
2,978
2,475
50,372
58,132
48.6%
53.6%
38,957
(14,488)
24,469
22.6%
47,006
(10,920)
(2,897)
33,189
30.6%
32,481
(7,959)
(4,207)
20,315
18.7%
77,973
71.9%
(65,765)
36,345
4,207
5,372
(19,841)
-18.3%
$
Q4'22
119,321
56,738
62,583
2,938
2,475
51,325
67,996
52.4 %
57.0 %
37,197
(11,469)
25,728
21.6%
44,623
(7,885)
(2,575)
34,163
28.6%
29,225
(9,126)
20,099
16.8%
79,990
67.0%
(48,462)
31,418
5,050
(11,994)
-10.1%
Q1'23
117,564
57,310
60,254
2,681
2,475
52,154
65,410
51.3 %
55.6 %
37,431
(11,481)
25,950
22.1%
44,271
(6,705)
(2,575)
34,991
29.8%
25,827
(7,284)
18,543
15.8%
79,484
67.6%
(47,275)
28,151
5,050
(14,074)
-12.0%
$
$
$
$
$
$
$
$
FY'21
354,330
167,002
187,328
7,227
9,900
149,875
204,455
52.9 %
57.7 %
126,859
(47,019)
79,840
22.5%
152,645
(31,159)
(10,944)
110,542
31.2%
126,845
(55,083)
(2,555)
69,207
19.5%
259,589
73.3%
(219,021)
140,488
20,844
2,555
(55,134)
-15.6%
$
Ś
$
$
$
$
$
$
FY'22
432,725
222,944
209,781
12,050
9,900
200,994
231,731
48.5 %
53.6%
155,308
(58,435)
96,873
22.4%
179,869
(39,083)
(10,891)
129,895
30.0%
120,803
(33,195)
(4,207)
(1,970)
81,431
18.8%
308,199
71.2%
(246,199)
142,763
4,207
20,791
1,970
(76,468)
-17.7%
fastly
Investor Day | 2023View entire presentation