Goldman Sachs Results Presentation Deck
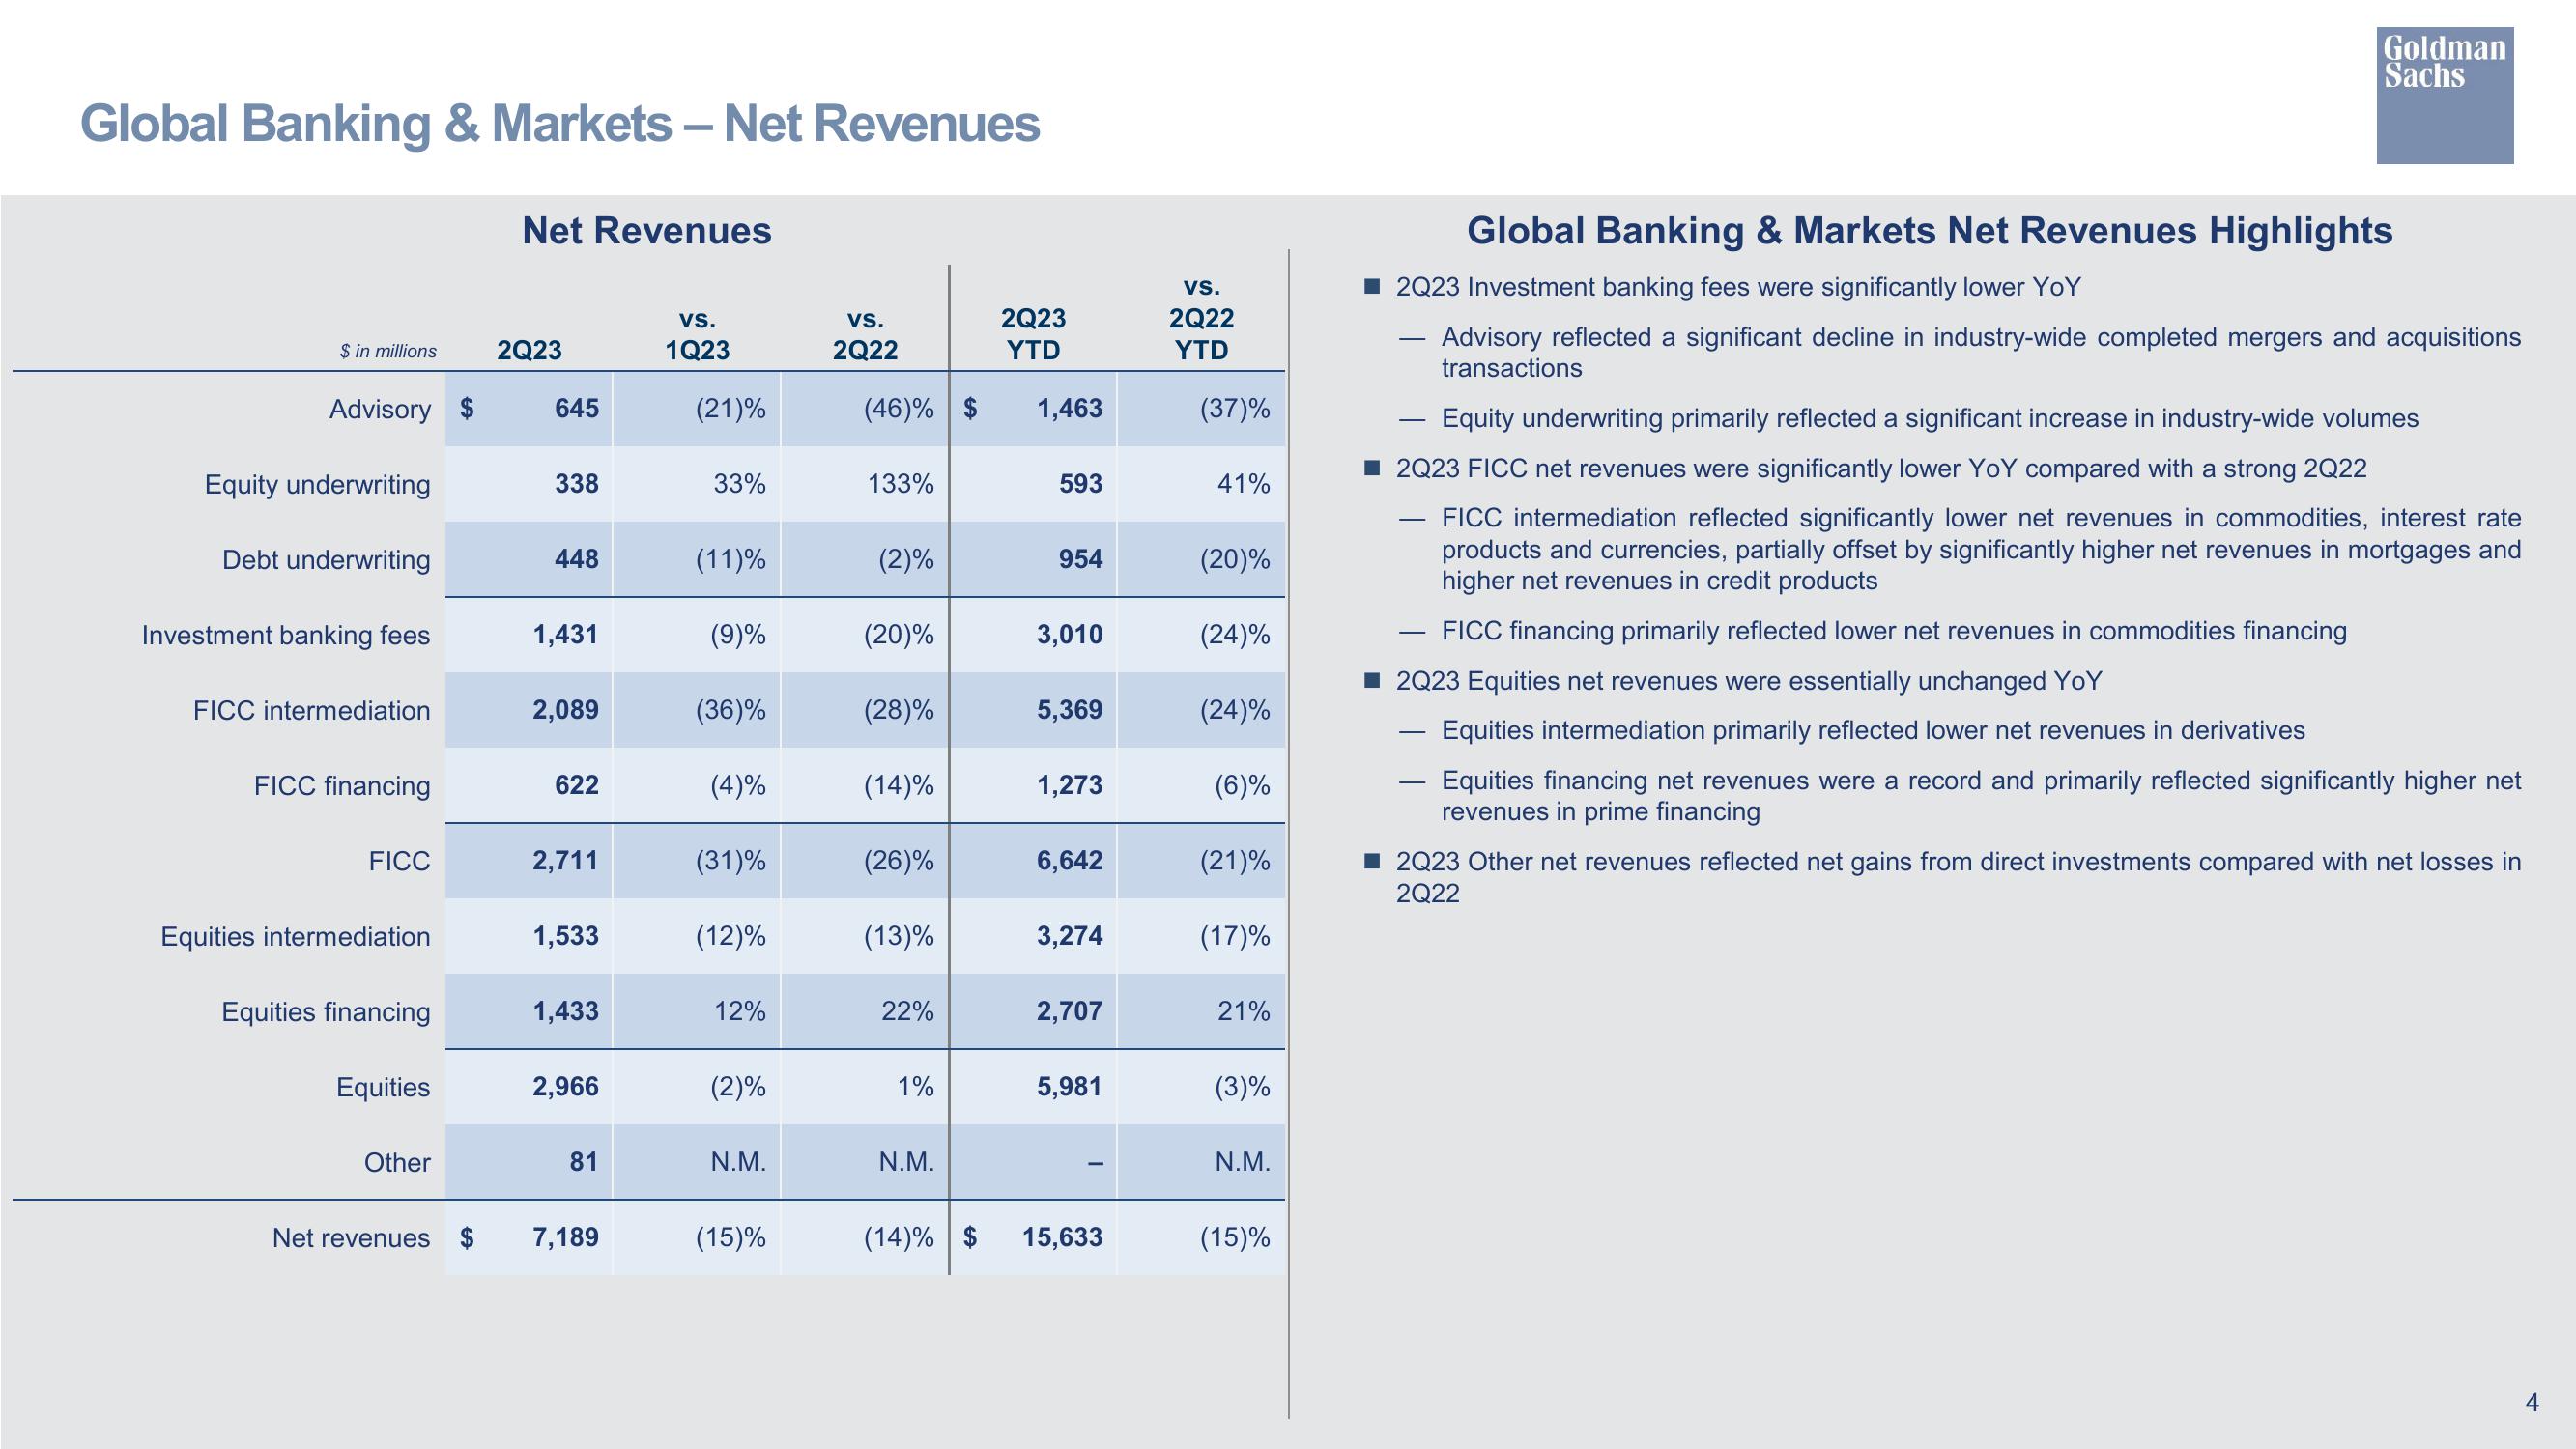
Global Banking & Markets - Net Revenues
$ in millions
Advisory $
Equity underwriting
Debt underwriting
Investment banking fees
FICC intermediation
FICC financing
FICC
Equities intermediation
Equities financing
Equities
Other
Net revenues
Net Revenues
2Q23
645
338
448
1,431
2,089
622
2,711
1,533
1,433
2,966
81
7,189
VS.
1Q23
(21)%
33%
(11)%
(9)%
(36)%
(4)%
(31)%
(12)%
12%
(2)%
N.M.
(15)%
2Q23
YTD
(46)%$ 1,463
VS.
2Q22
133%
(2)%
(20)%
(28)%
(14)%
(26)%
(13)%
22%
1%
N.M.
593
954
3,010
5,369
1,273
6,642
3,274
2,707
5,981
(14)%$ 15,633
VS.
2Q22
YTD
(37)%
41%
(20)%
(24)%
(24)%
(6)%
(21)%
(17)%
21%
(3)%
N.M.
(15)%
Global Banking & Markets Net Revenues Highlights
2Q23 Investment banking fees were significantly lower YoY
-
Goldman
Sachs
Equity underwriting primarily reflected a significant increase in industry-wide volumes
2Q23 FICC net revenues were significantly lower YoY compared with a strong 2Q22
FICC intermediation reflected significantly lower net revenues in commodities, interest rate
products and currencies, partially offset by significantly higher net revenues in mortgages and
higher net revenues in credit products
FICC financing primarily reflected lower net revenues in commodities financing
■2Q23 Equities net revenues were essentially unchanged YoY
Equities intermediation primarily reflected lower net revenues in derivatives
Equities financing net revenues were a record and primarily reflected significantly higher net
revenues in prime financing
-
-
Advisory reflected a significant decline in industry-wide completed mergers and acquisitions
transactions
■ 2Q23 Other net revenues reflected net gains from direct investments compared with net losses in
2Q22
4View entire presentation