PB Bankshares Results Presentation Deck
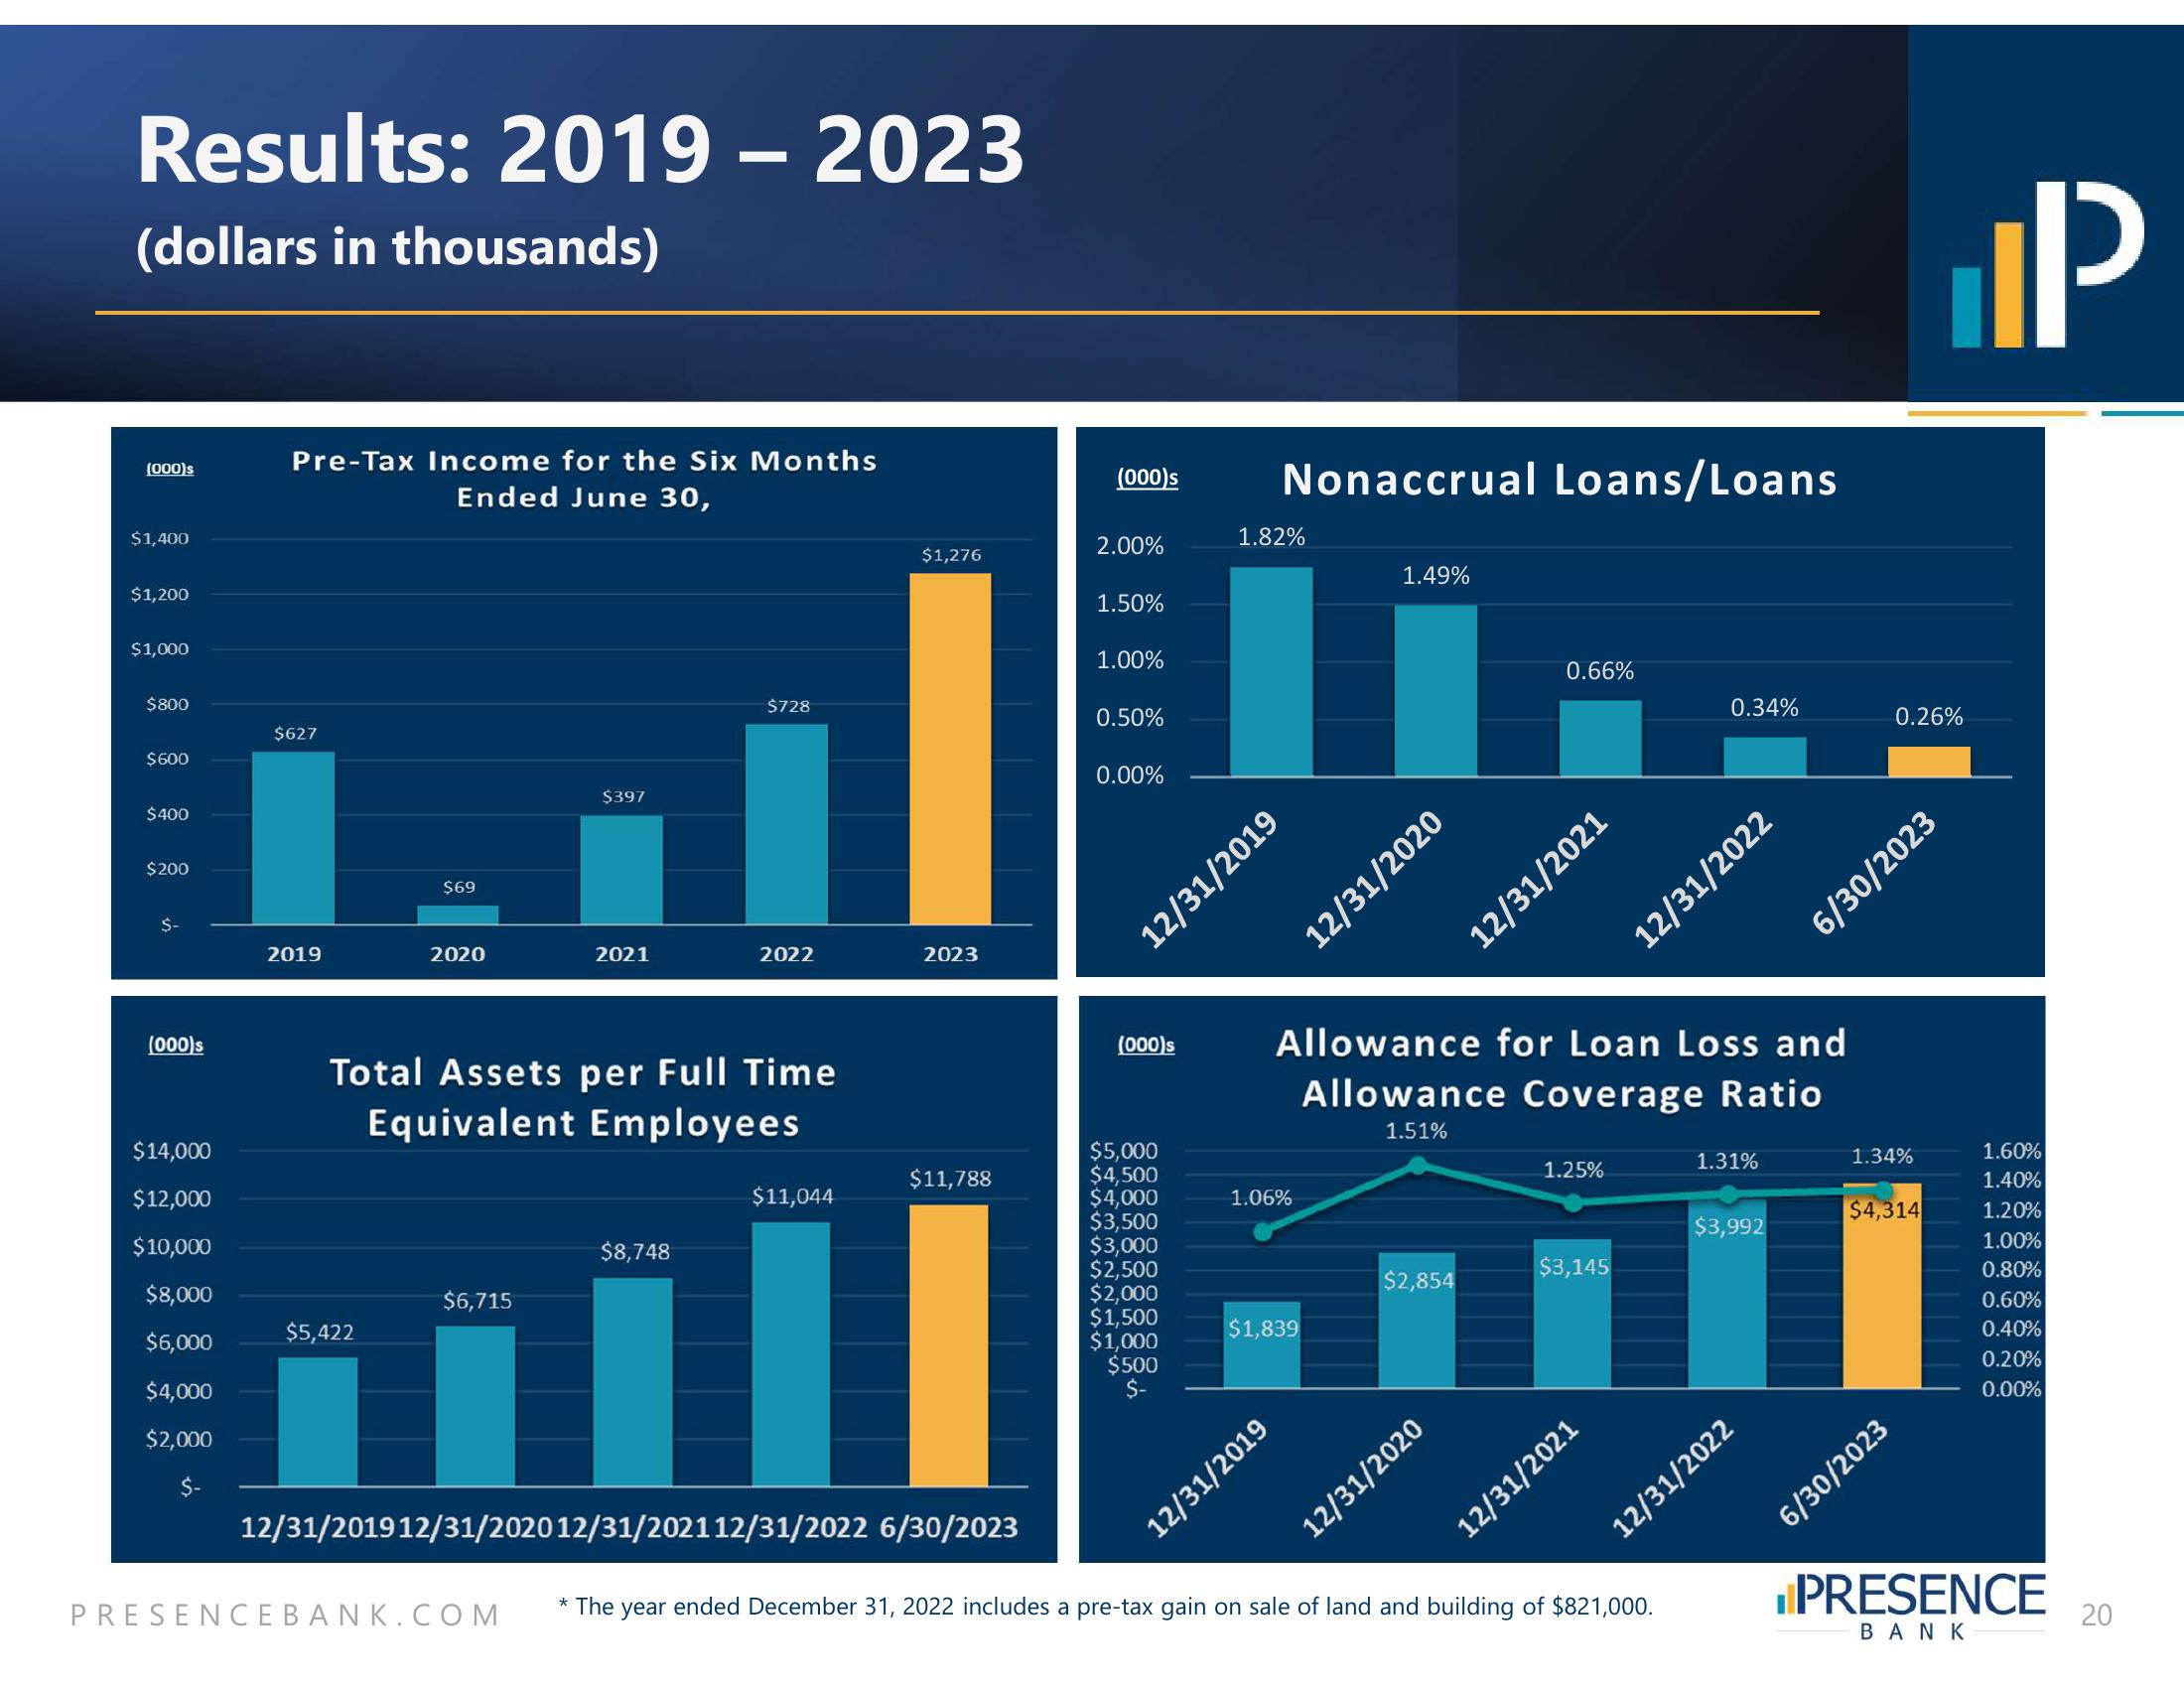
Results: 2019-2023
(dollars in thousands)
(000)s
$1,400
$1,200
$1,000
$800
$600
$400
$200
$-
(000)s
$14,000
$12,000
$10,000
$8,000
$6,000
$4,000
$2,000
Pre-Tax Income for the Six Months
Ended June 30,
$627
2019
$69
$5,422
2020
$6,715
$397
2021
Total Assets per Full Time
Equivalent Employees
PRESENCEBANK.COM
$728
$8,748
2022
$1,276
2023
$11,788
$11,044
II
12/31/201912/31/2020 12/31/202112/31/2022 6/30/2023
(000)s
2.00%
1.50%
1.00%
0.50%
0.00%
(000)s
$5,000
$4,500
$4,000
$3,500
$3,000
$2,500
$2,000
$1,500
$1,000
$500
$-
Nonaccrual Loans/Loans
1.82%
12/31/2019
1.06%
$1,839
1.49%
12/31/2019
12/31/2020
Allowance for Loan Loss and
Allowance Coverage Ratio
1.51%
$2,854
0.66%
12/31/2021
12/31/2020
1.25%
$3,145
12/31/2021
0.34%
12/31/2022
* The year ended December 31, 2022 includes a pre-tax gain on sale of land and building of $821,000.
1.31%
$3,992
12/31/2022
0.26%
1.34%
6/30/2023
$4,314
6/30/2023
קן
1.60%
1.40%
1.20%
1.00%
0.80%
0.60%
0.40%
0.20%
0.00%
PRESENCE
ΒΑΝΚ
20View entire presentation