BigCommerce Results Presentation Deck
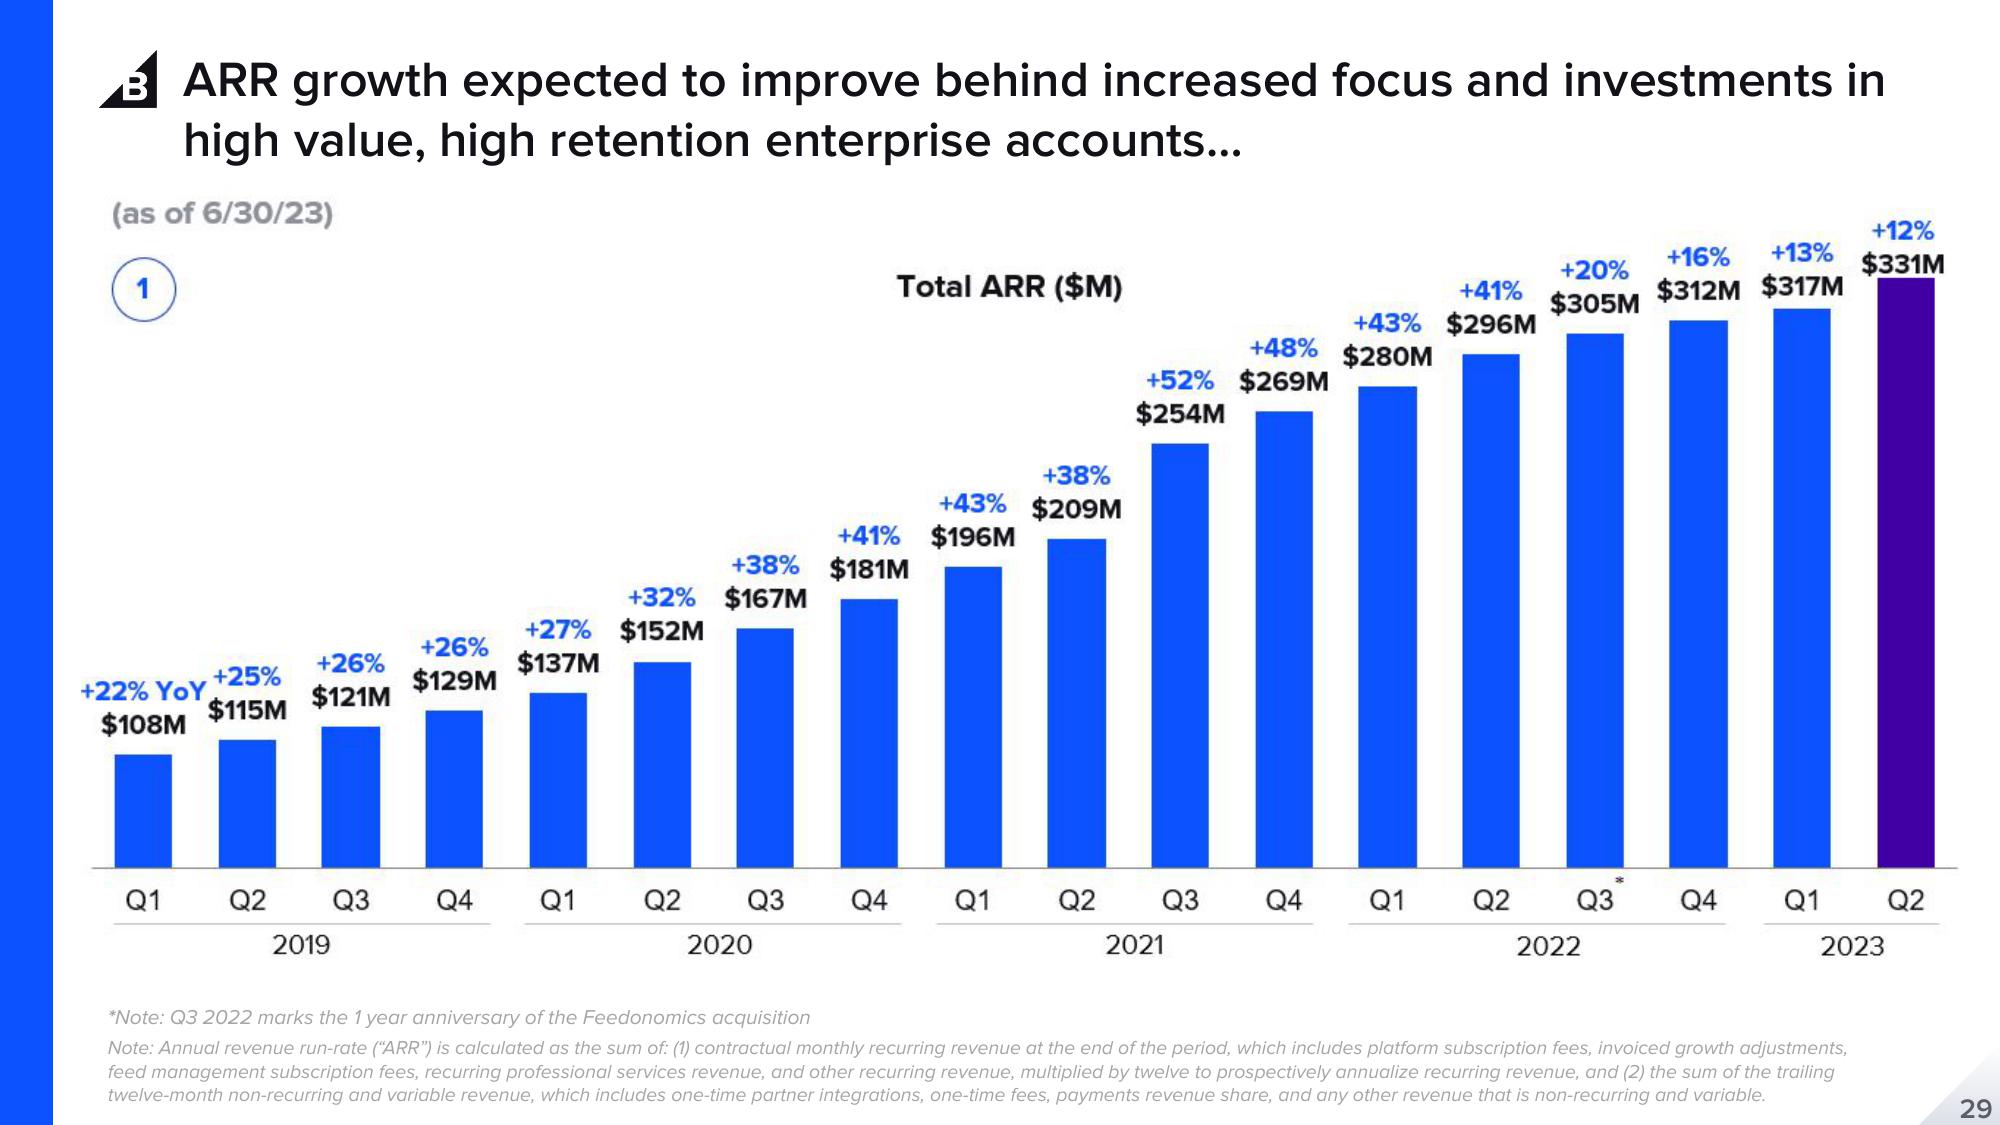
BARR growth expected to improve behind increased focus and investments in
high value, high retention enterprise accounts...
(as of 6/30/23)
1
+22% YoY
$108M
Q1
+26%
+25%
$121M
$115M
Q2
2019
+26%
$129M
Q3
+27% $152M
$137M
Q4 Q1
+32% $167M
Q2
+38% $181M
Q3
2020
Total ARR ($M)
+41% $196M
Q4
+38%
+43% $209M
Q1
Q2
+52% $269M
$254M
Q3
2021
+48% $280M
+41%
+43% $296M
Q4
Q1
+20%
$305M
Q2 Q3
2022
+16% +13%
$312M $317M
+12%
$331M
Q4 Q1 Q2
2023
*Note: Q3 2022 marks the 1 year anniversary of the Feedonomics acquisition
Note: Annual revenue run-rate ("ARR") is calculated as the sum of: (1) contractual monthly recurring revenue at the end of the period, which includes platform subscription fees, invoiced growth adjustments,
feed management subscription fees, recurring professional services revenue, and other recurring revenue, multiplied by twelve to prospectively annualize recurring revenue, and (2) the sum of the trailing
twelve-month non-recurring and variable revenue, which includes one-time partner integrations, one-time fees, payments revenue share, and any other revenue that is non-recurring and variable.
29View entire presentation