Hanmi Financial Results Presentation Deck
Total Balance
Average
Median
(3)
Top Quintile Balance
Top Quintile Loan Size
Top Quintile Average
Top Quintile Median
Owner
Occupied
$763
$1.01
$0.32
$573
$1.2 or more
$3.82
$2.09
CRE
Non-owner
Occupied
$2,607
$2.95
$1.12
$1,866
$3.5 or more
$10.67
$6.79
Multifamily
$419
$2.70
$1.11
$302
$2.5 or more
$9.74
$4.71
Total Balance
Average
Median
($ in millions)
Top Quintile Balance (³)
Top Quintile Loan Size
Top Quintile Average
Top Quintile Median
(1)
Construction
$100
$11.15
$7.99
$58
$22.3 or more
$29.23
$29.23
Residential Real Estate & Equipment Finance
Loan Portfolio Distribution
Total Balance
Average
Median
Residential Real Estate
$963
$0.54
$0.46
$397
$0.7 or more
$1.12
$0.92
(3)
Top Quintile Balance
Top Quintile Loan Size
Top Quintile Average
Top Quintile Median
Equipment Finance
$582
$0.05
$0.03
$298
$0.1 or more
$0.12
$0.10
C&I
(2)
Term
$374
$0.36
$0.05
$331
$0.1 or more
$1.63
$0.24
(1)
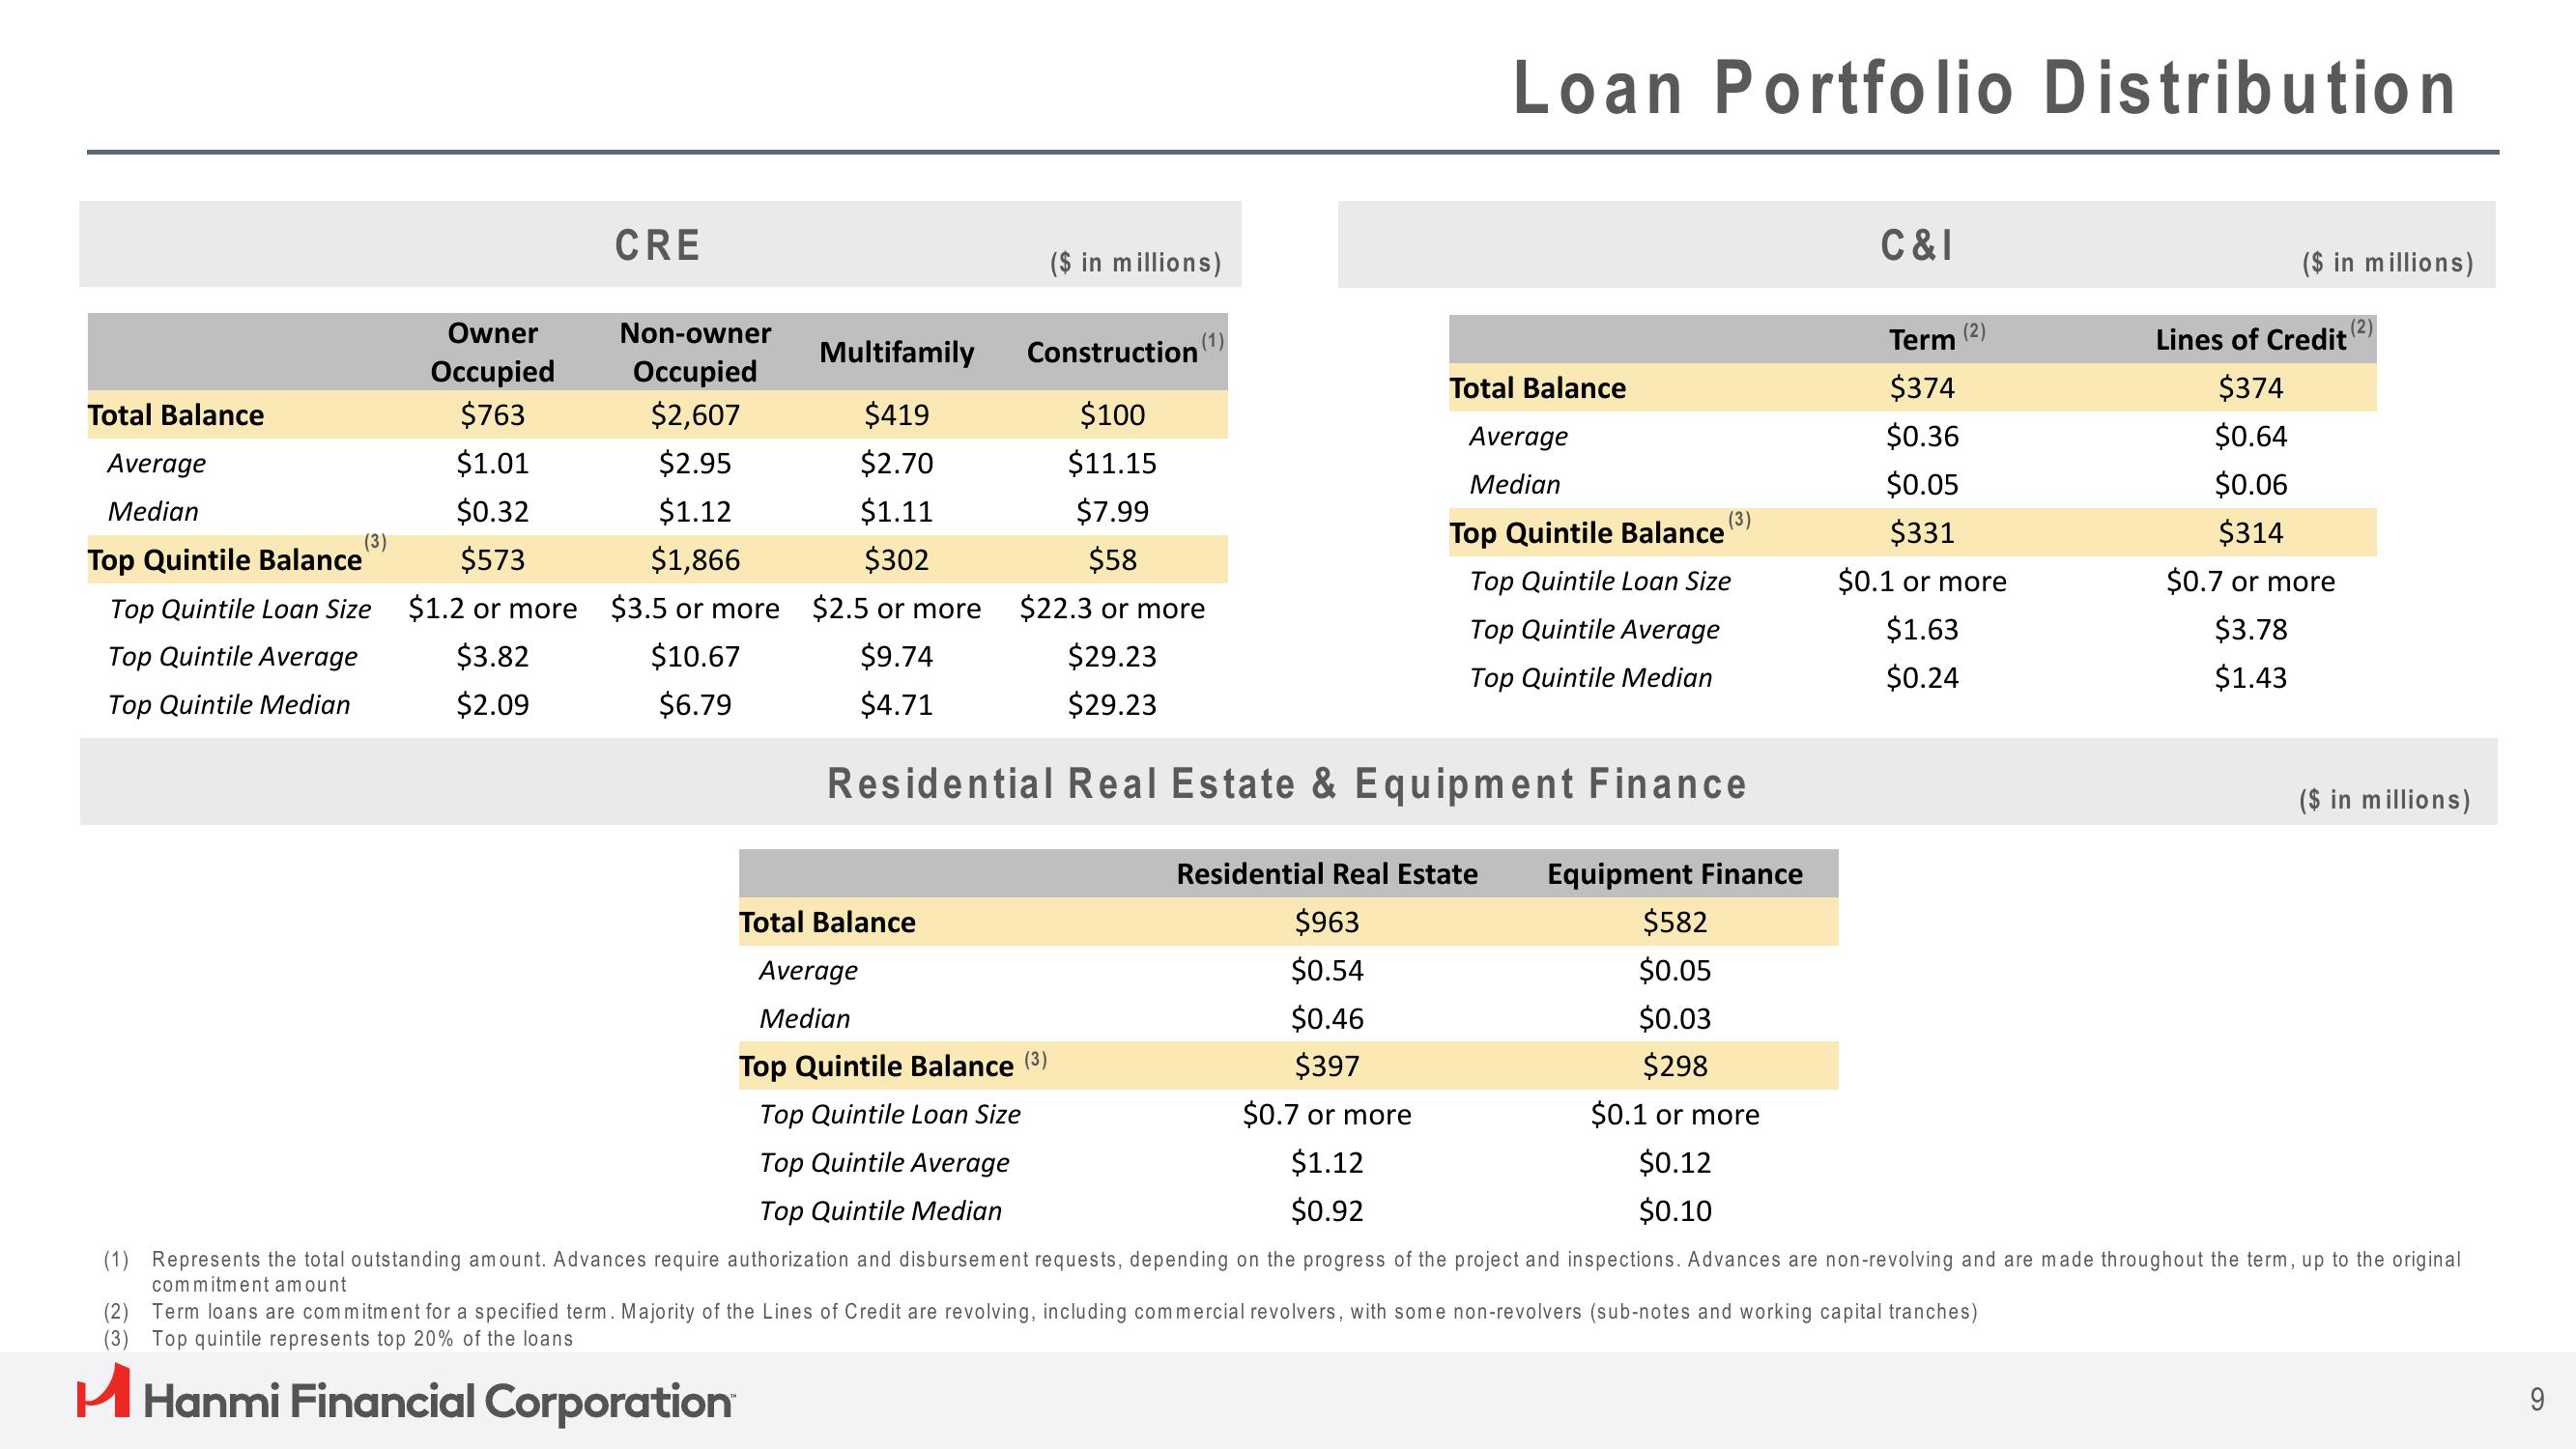
(2) Term loans are commitment for a specified term. Majority of the Lines of Credit are revolving, including commercial revolvers, with some non-revolvers (sub-notes and working capital tranches)
(3) Top quintile represents top 20% of the loans
H Hanmi Financial Corporation
($ in millions)
(2)
Lines of Credit
$374
$0.64
$0.06
$314
$0.7 or more
$3.78
$1.43
($ in millions)
Represents the total outstanding amount. Advances require authorization and disbursement requests, depending on the progress of the project and inspections. Advances are non-revolving and are made throughout the term, up to the original
commitment amount
9View entire presentation