AstraZeneca Results Presentation Deck
Total Revenue ($m)
Q2 dynamics
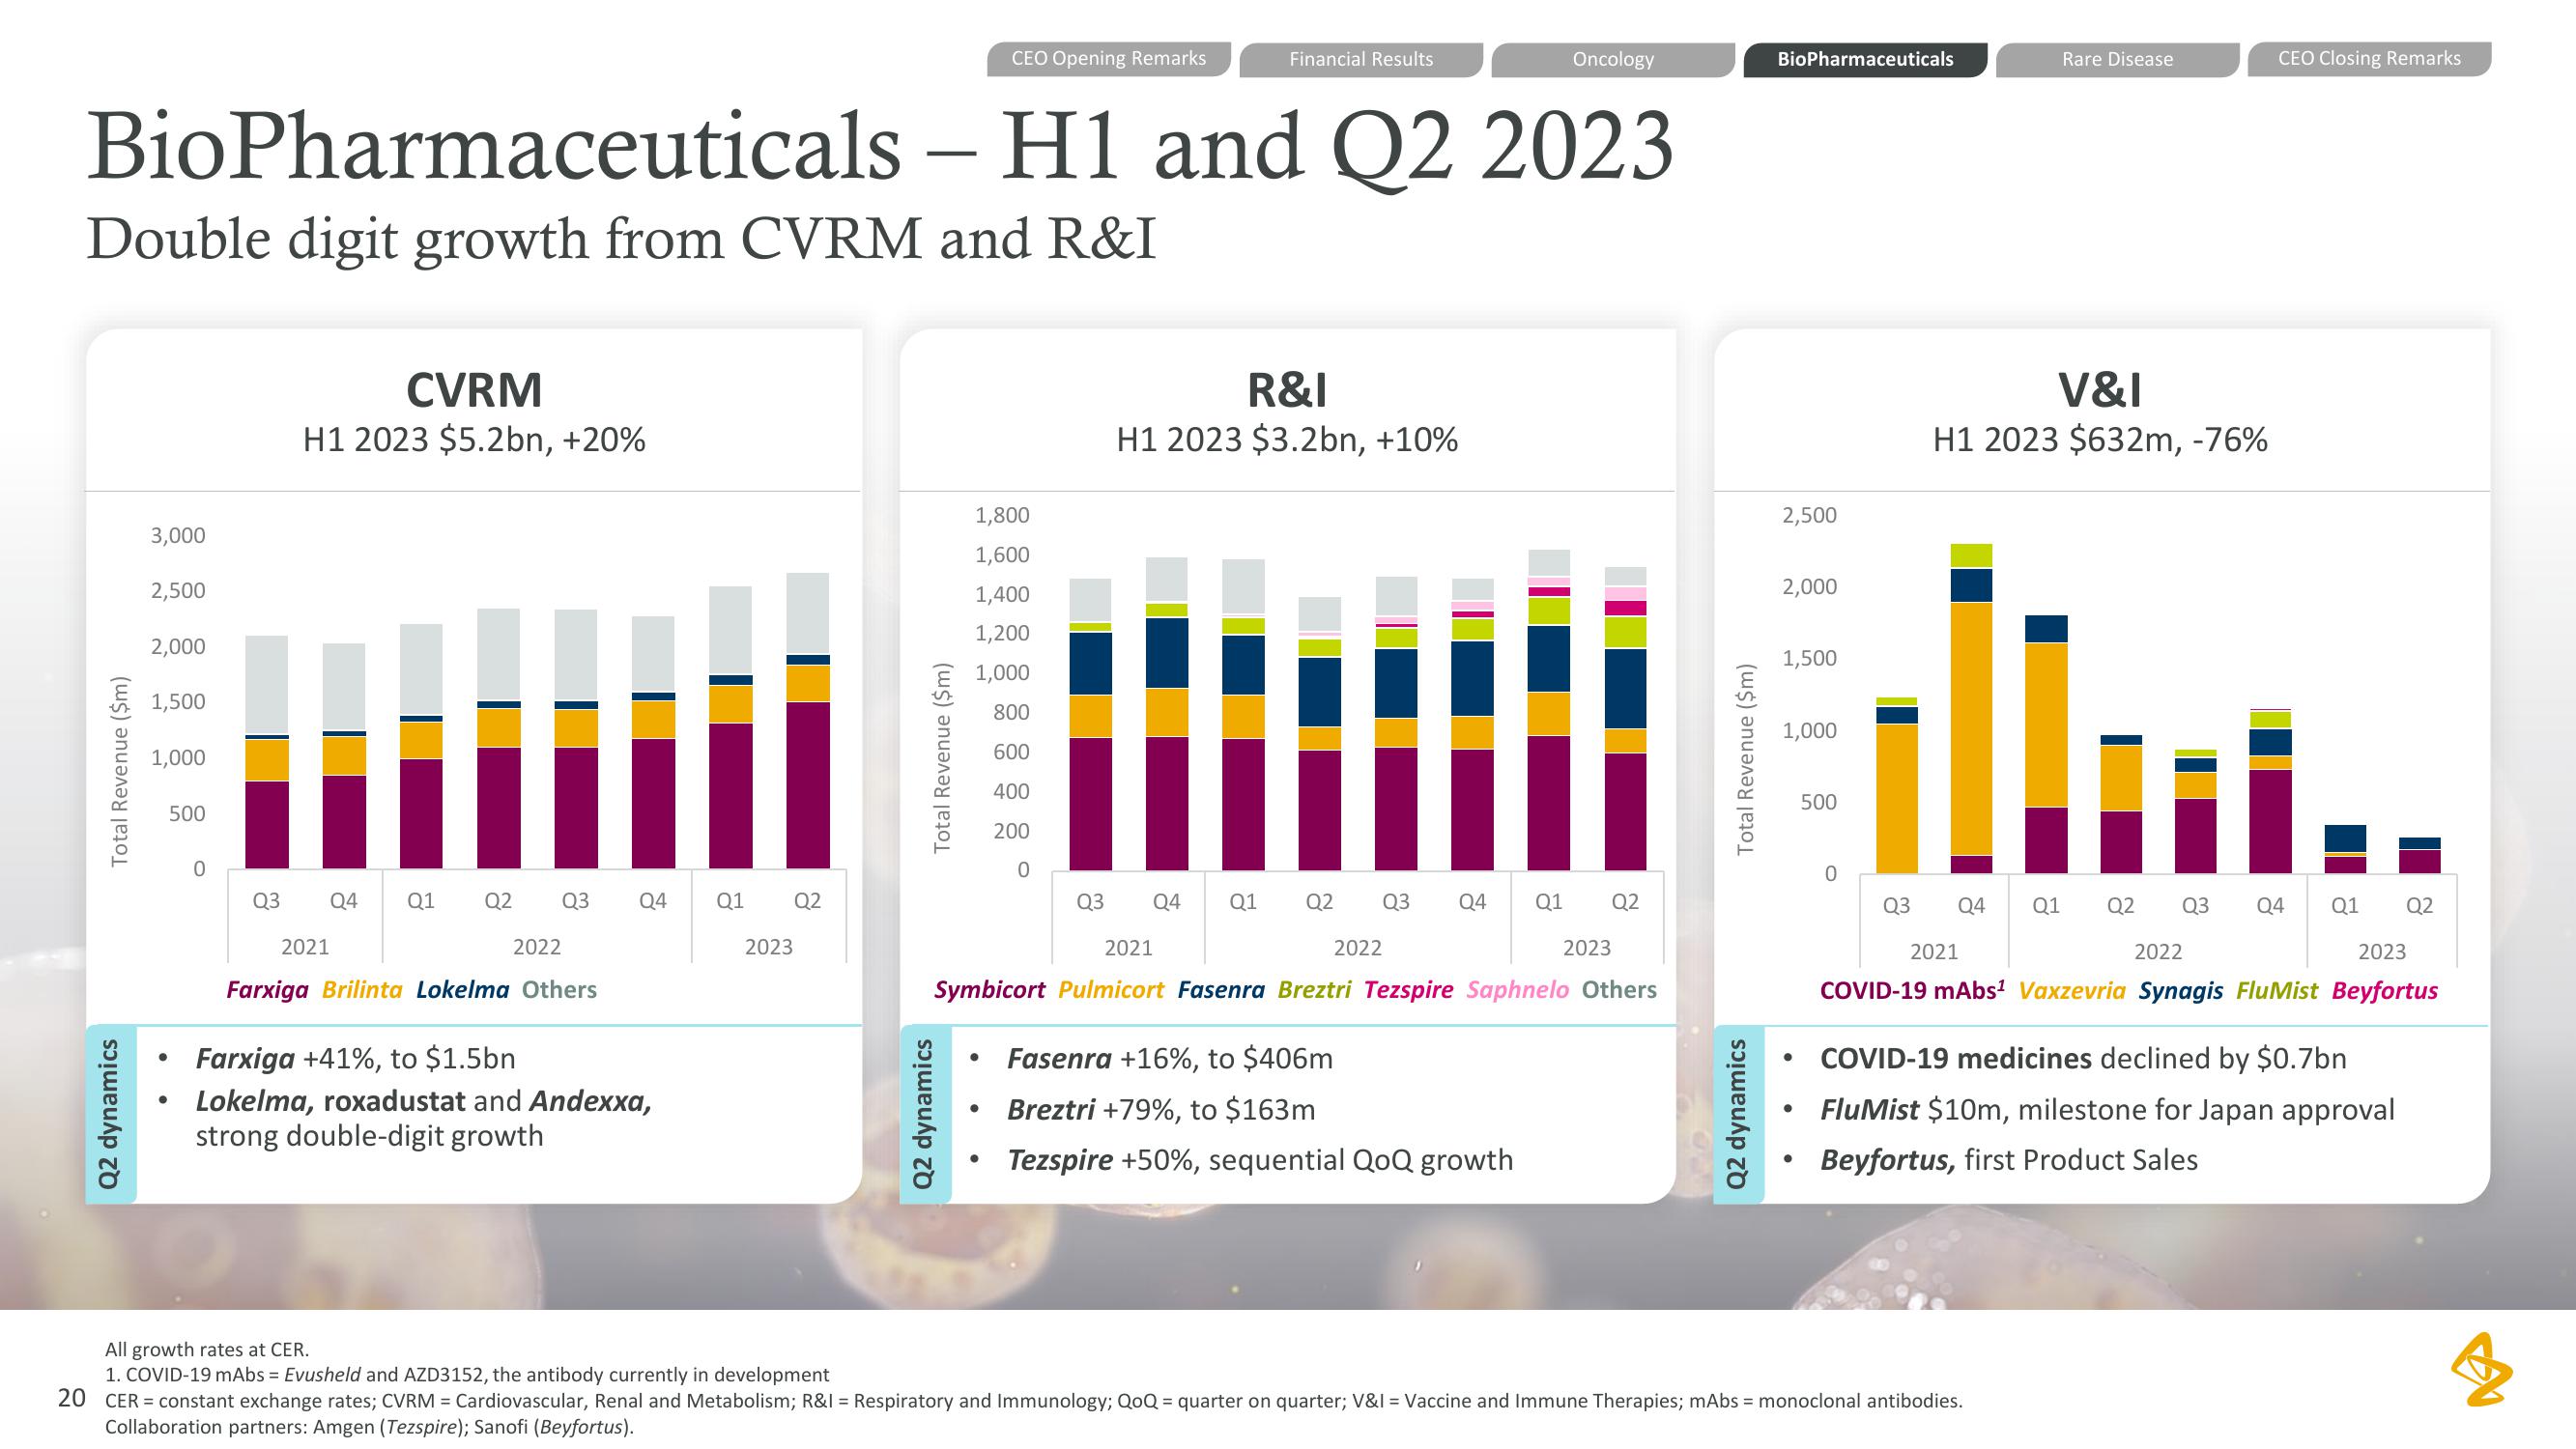
BioPharmaceuticals - H1 and Q2 2023
Double digit growth from CVRM and R&I
3,000
2,500
2,000
1,500
1,000
500
●
0
Q3
CVRM
H1 2023 $5.2bn, +20%
Q4 Q1 Q2 Q3 Q4 Q1 Q2
2021
2022
Farxiga Brilinta Lokelma Others
Farxiga +41%, to $1.5bn
Lokelma, roxadustat and Andexxa,
strong double-digit growth
2023
Total Revenue ($m)
CEO Opening Remarks
Q2 dynamics
1,800
1,600
1,400
1,200
1,000
800
600
400
200
0
Q3
Financial Results
R&I
H1 2023 $3.2bn, +10%
Q4
Oncology
Q1 Q2 Q3 Q4 Q1 Q2
2021
Symbicort Pulmicort Fasenra Breztri Tezspire Saphnelo Others
2022
Fasenra +16%, to $406m
Breztri +79%, to $163m
Tezspire +50%, sequential QoQ growth
2023
Total Revenue ($m)
Q2 dynamics
BioPharmaceuticals
2,500
2,000
1,500
1,000
●
●
●
500
0
Q3
V&I
H1 2023 $632m, -76%
Rare Disease
Q4 Q1 Q2 Q3 Q4 Q1 Q2
2021
CEO Closing Remarks
2022
2023
COVID-19 mAbs¹ Vaxzevria Synagis FluMist Beyfortus
All growth rates at CER.
1. COVID-19 mAbs = Evusheld and AZD3152, the antibody currently in development
20 CER = constant exchange rates; CVRM = Cardiovascular, Renal and Metabolism; R&I = Respiratory and Immunology; QoQ = quarter on quarter; V&I= Vaccine and Immune Therapies; mAbs = monoclonal antibodies.
Collaboration partners: Amgen (Tezspire); Sanofi (Beyfortus).
COVID-19 medicines declined by $0.7bn
FluMist $10m, milestone for Japan approval
Beyfortus, first Product SalesView entire presentation