Comcast Results Presentation Deck
Connectivity
& Platforms
Adj.
EBITDA
Margin
6
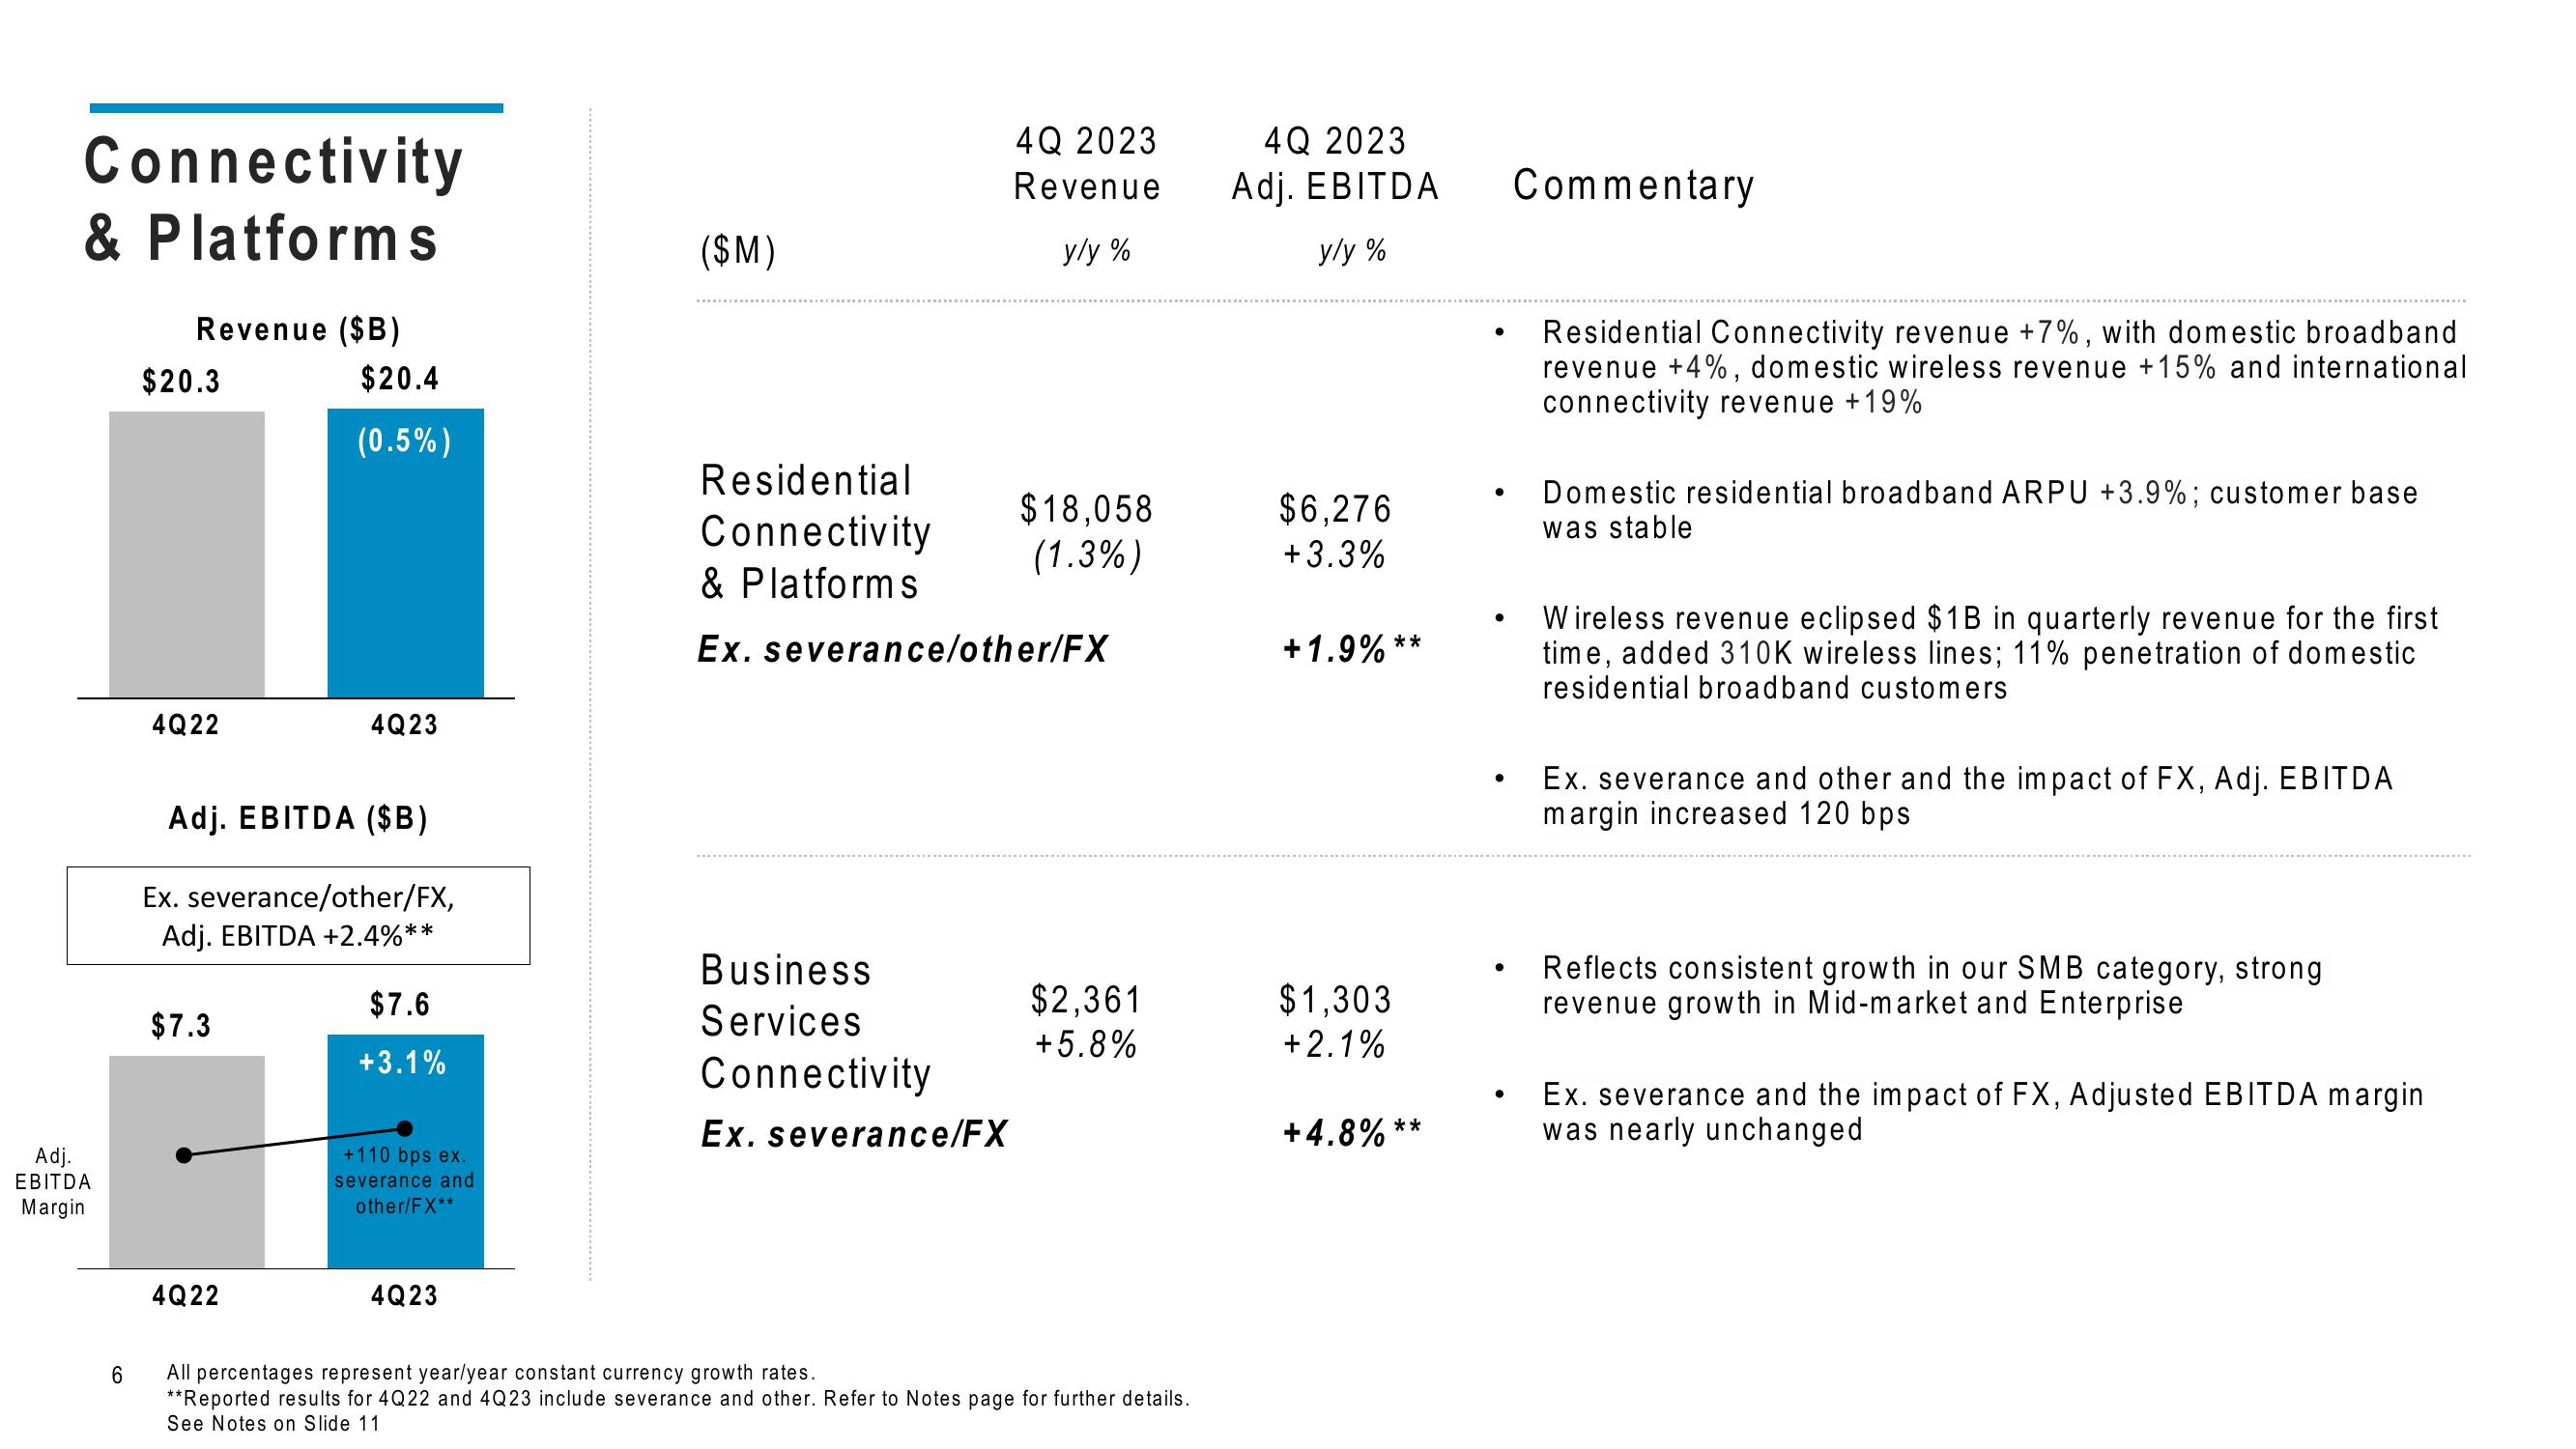
Revenue ($B)
$20.3
4Q22
$7.3
$20.4
(0.5%)
Adj. EBITDA ($B)
Ex. severance/other/FX,
Adj. EBITDA +2.4%**
4Q22
4Q23
$7.6
+3.1%
+110 bps ex.
severance and
other/FX**
4Q23
($M)
4Q 2023
Revenue
y/y%
Residential
Connectivity
& Platforms
Ex. severance/other/FX
Business
Services
Connectivity
Ex. severance/FX
$18.058
(1.3%)
$2,361
+5.8%
All percentages represent year/year constant currency growth rates.
**Reported results for 4Q22 and 4Q23 include severance and other. Refer to Notes page for further details.
See Notes on Slide 11
4Q 2023
Adj. EBITDA
y/y%
$6,276
+3.3%
+1.9% **
$1,303
+ 2.1%
+ 4.8%
**
●
●
●
Commentary
Residential Connectivity revenue +7%, with domestic broadband
revenue +4%, domestic wireless revenue +15% and international
connectivity revenue +19%
Domestic residential broadband ARPU +3.9%; customer base
was stable
Wireless revenue eclipsed $1B in quarterly revenue for the first
time, added 310K wireless lines; 11% penetration of domestic
residential broadband customers
Ex. severance and other and the impact of FX, Adj. EBITDA
margin increased 120 bps
Reflects consistent growth in our SMB category, strong
revenue growth in Mid-market and Enterprise
Ex. severance and the impact of FX, Adjusted EBITDA margin
was nearly unchangedView entire presentation