DraftKings SPAC Presentation Deck
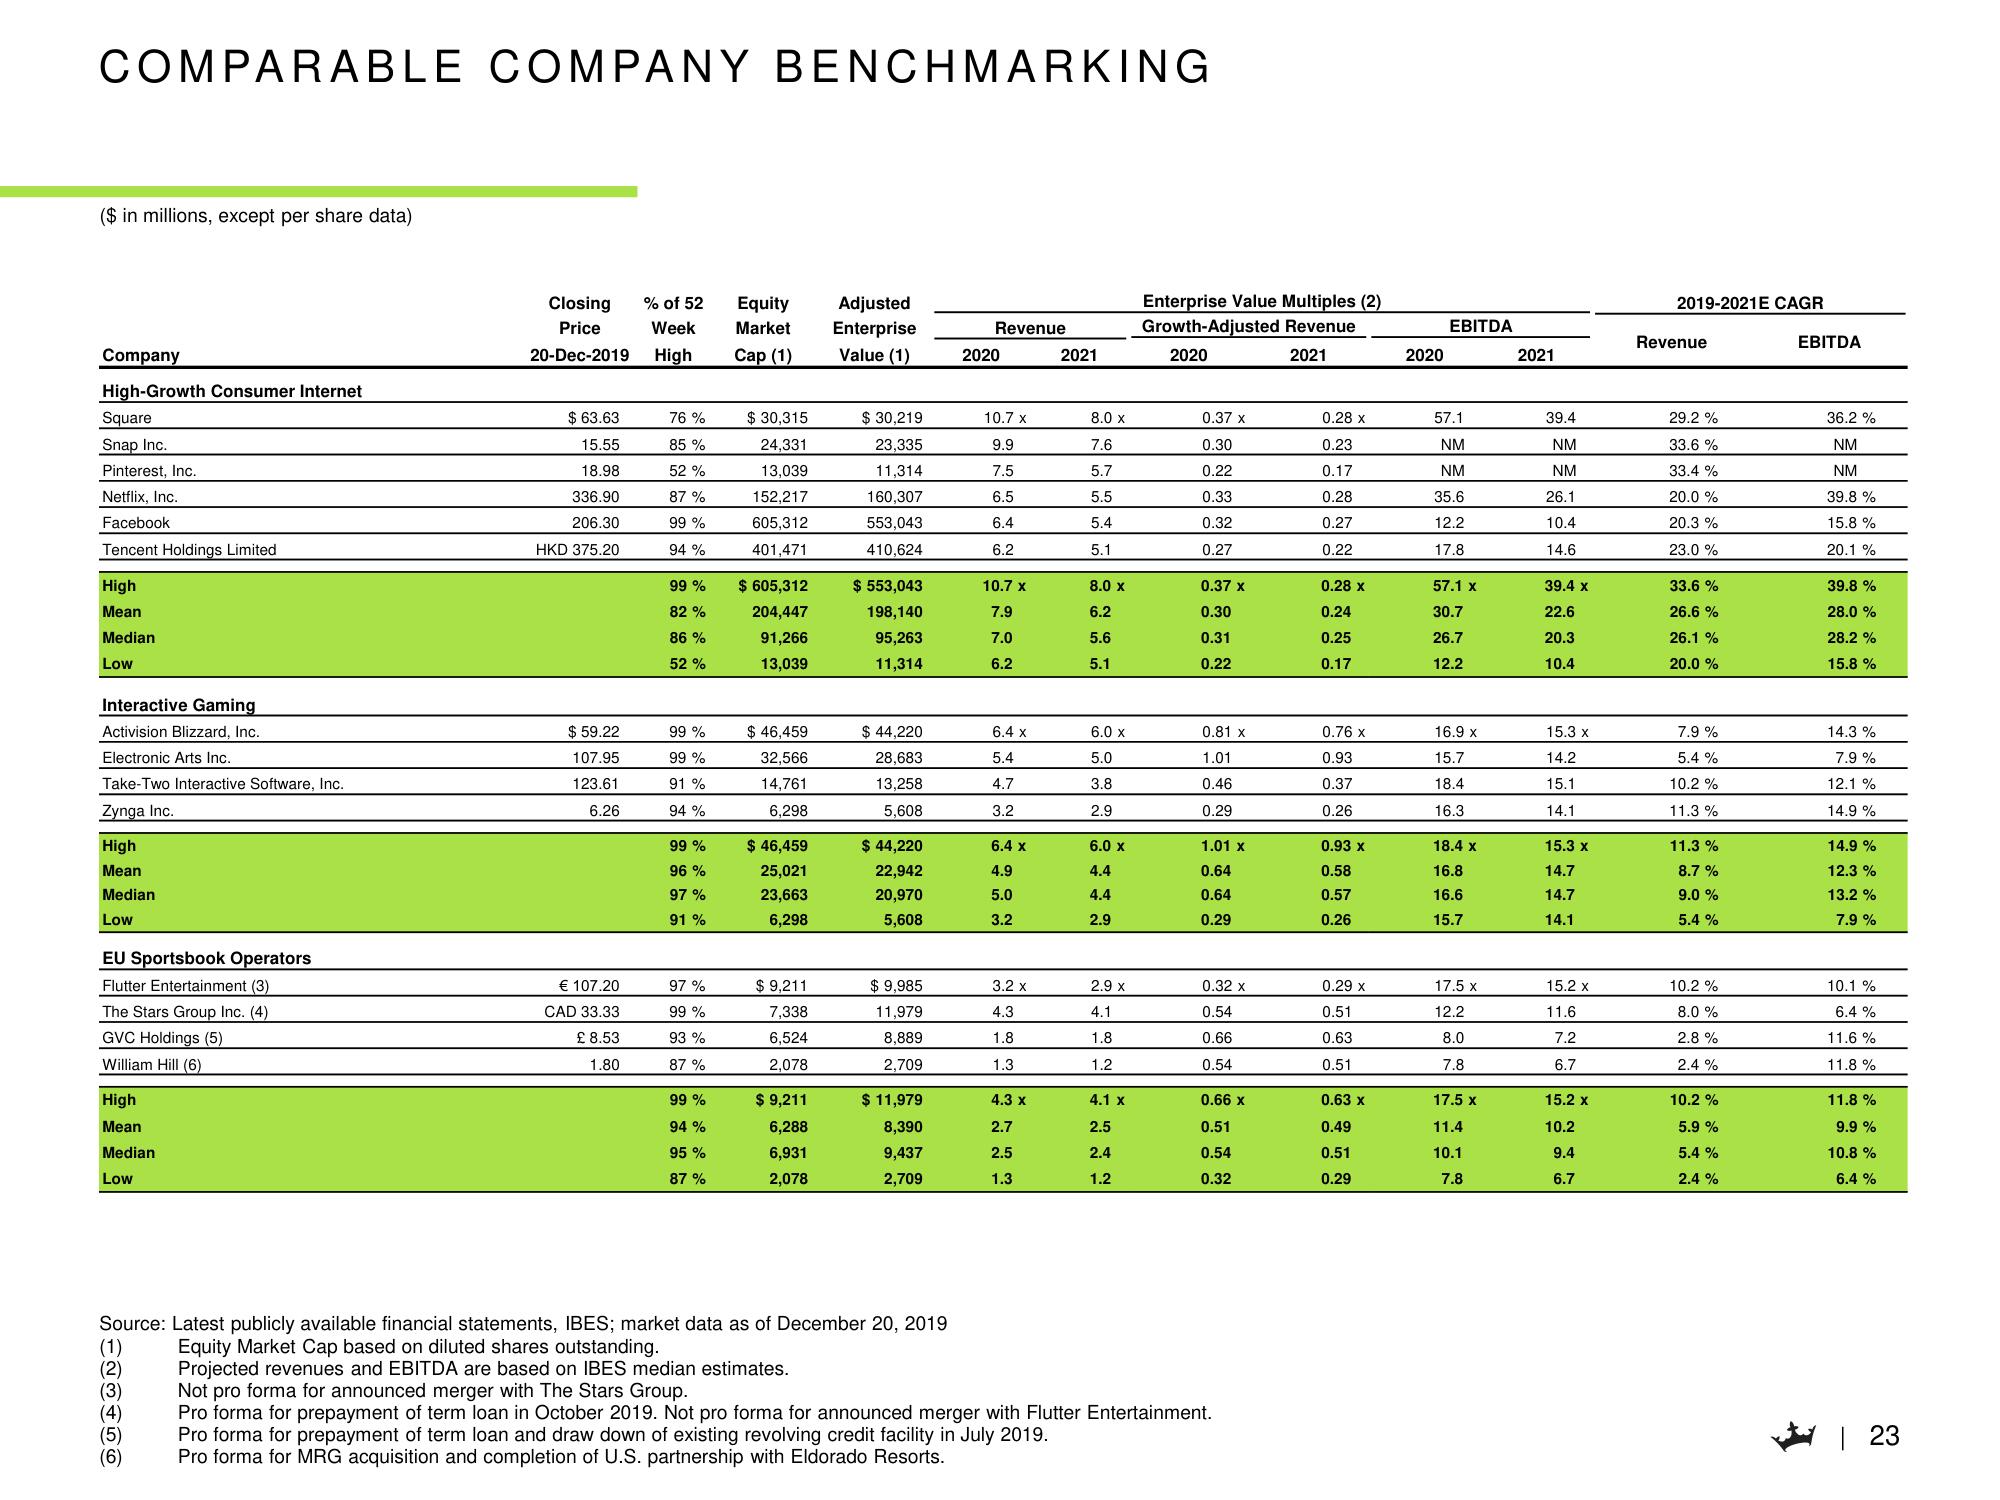
COMPARABLE COMPANY BENCHMARKING
($ in millions, except per share data)
Company
High-Growth Consumer Internet
Square
Snap Inc.
Pinterest, Inc.
Netflix, Inc.
Facebook
Tencent Holdings Limited
High
Mean
Median
Low
Interactive Gaming
Activision Blizzard, Inc.
Electronic Arts Inc.
Take-Two Interactive Software, Inc.
Zynga Inc.
High
Mean
Median
Low
EU Sportsbook Operators
Flutter Entertainment (3)
The Stars Group Inc. (4)
GVC Holdings (5)
William Hill (6)
High
Mean
Median
Low
(1)
(2)
(3)
Closing
Price
20-Dec-2019
(5)
(6)
$63.63
15.55
18.98
336.90
206.30
HKD 375.20
$ 59.22
107.95
123.61
6.26
€ 107.20
CAD 33.33
£ 8.53
1.80
% of 52
Week
High
76%
85 %
52 %
87%
99%
94%
99 %
82%
86%
52 %
99 %
99 %
91 %
94 %
99 %
96 %
97 %
91 %
97%
99 %
93 %
87%
99%
94%
95%
87%
Equity Adjusted
Market Enterprise
Cap (1) Value (1)
$30,315
24,331
13,039
152,217
605,312
401,471
$ 605,312
204,447
91,266
13,039
$ 46,459
32,566
14,761
6,298
$ 46,459
25,021
23,663
6,298
$ 9,211
7,338
6,524
2,078
$ 9,211
6,288
6,931
2,078
$ 30,219
23,335
11,314
160,307
553,043
410,624
$ 553,043
198,140
95,263
11,314
$ 44,220
28,683
13,258
5,608
$ 44,220
22,942
20,970
5,608
$ 9,985
11,979
8,889
2,709
$ 11,979
8,390
9,437
2,709
Revenue
2020
10.7 x
9.9
7.5
6.5
6.4
6.2
10.7 x
7.9
7.0
6.2
6.4 x
5.4
4.7
3.2
6.4 x
4.9
5.0
3.2
3.2 x
4.3
1.8
1.3
4.3 x
2.7
2.5
1.3
2021
8.0 x
7.6
5.7
5.5
5.4
5.1
8.0 x
6.2
5.6
5.1
6.0 x
5.0
3.8
2.9
6.0 x
4.4
4.4
2.9
2.9 x
4.1
1.8
1.2
4.1 x
2.5
2.4
1.2
Enterprise Value Multiples (2)
Growth-Adjusted Revenue
2020
2021
0.37 x
0.30
0.22
0.33
0.32
0.27
0.37 x
0.30
0.31
0.22
0.81 x
1.01
0.46
0.29
1.01 X
0.64
0.64
0.29
0.32 x
0.54
0.66
0.54
Source: Latest publicly available financial statements, IBES; market data as of December 20, 2019
Equity Market Cap based on diluted shares outstanding.
Projected revenues and EBITDA are based on IBES median estimates.
Not pro forma for announced merger with The Stars Group.
Pro forma for prepayment of term loan in October 2019. Not pro forma for announced merger with Flutter Entertainment.
Pro forma for prepayment of term loan and draw down of existing revolving credit facility in July 2019.
Pro forma for MRG acquisition and completion of U.S. partnership with Eldorado Resorts.
0.66 x
0.51
0.54
0.32
0.28 x
0.23
0.17
0.28
0.27
0.22
0.28 x
0.24
0.25
0.17
0.76 x
0.93
0.37
0.26
0.93 x
0.58
0.57
0.26
0.29 x
0.51
0.63
0.51
0.63 x
0.49
0.51
0.29
2020
EBITDA
57.1
NM
NM
35.6
12.2
17.8
57.1 x
30.7
26.7
12.2
16.9 x
15.7
18.4
16.3
18.4 x
16.8
16.6
15.7
17.5 x
12.2
8.0
7.8
17.5 x
11.4
10.1
7.8
2021
39.4
NM
NM
26.1
10.4
14.6
39.4 x
22.6
20.3
10.4
15.3 x
14.2
15.1
14.1
15.3 x
14.7
14.7
14.1
15.2 x
11.6
7.2
6.7
15.2 x
10.2
9.4
6.7
2019-2021E CAGR
Revenue
29.2 %
33.6%
33.4 %
20.0 %
20.3%
23.0%
33.6%
26.6 %
26.1 %
20.0 %
7.9%
5.4 %
10.2%
11.3%
11.3%
8.7 %
9.0 %
5.4 %
10.2 %
8.0 %
2.8%
2.4 %
10.2 %
5.9 %
5.4 %
2.4 %
EBITDA
36.2 %
NM
NM
39.8%
15.8%
20.1%
39.8 %
28.0 %
28.2 %
15.8 %
14.3%
7.9 %
12.1 %
14.9 %
14.9 %
12.3%
13.2 %
7.9 %
10.1 %
6.4 %
11.6 %
11.8%
11.8%
9.9 %
10.8 %
6.4 %
| 23View entire presentation