Avantor Results Presentation Deck
Q3 core organic revenue change by end market & product
Biopharma
Healthcare
Education &
government
BY END MARKET
Advanced tech
& applied materials
Navantor™
% OF
TOTAL SALES
~55%
~10%
~10%
~25%
Q3'23
-HSD
-HSD
+LSD
-LDD
BY PRODUCT
Proprietary materials
& consumables
Third-party materials
& consumables
Services & specialty
procurement
Equipment &
instrumentation
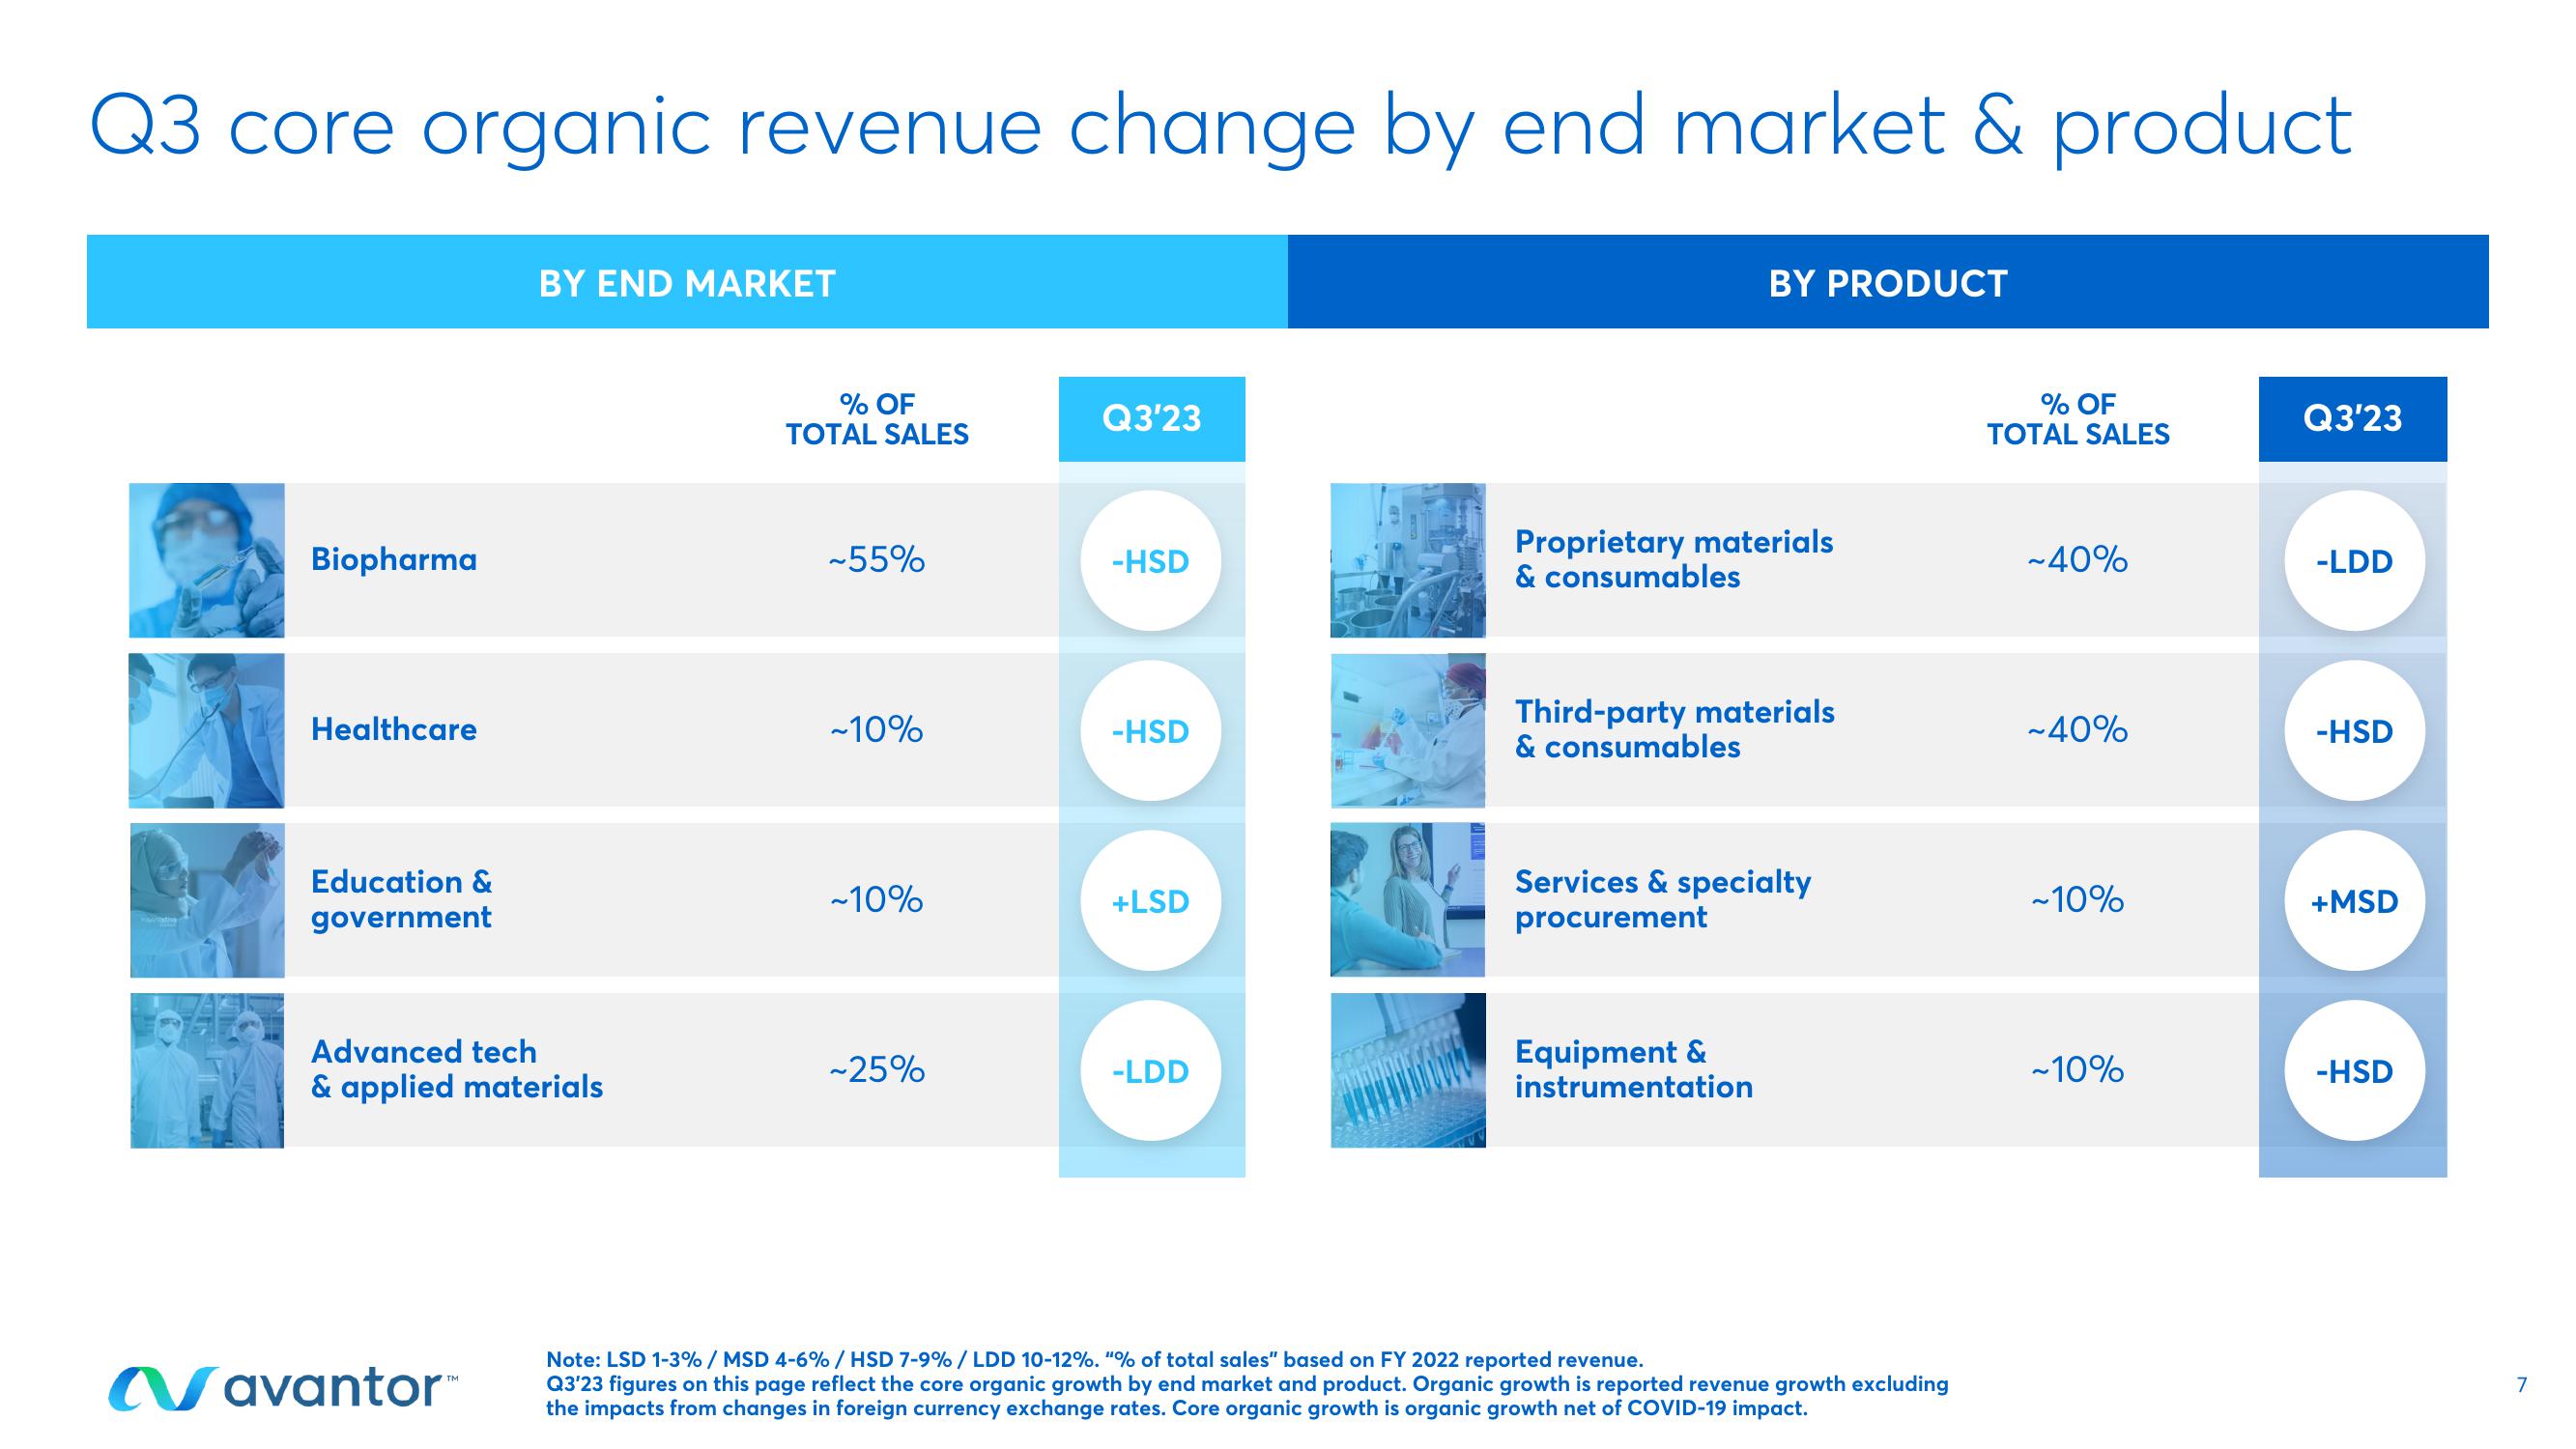
Note: LSD 1-3% / MSD 4-6% / HSD 7-9% / LDD 10-12%. "% of total sales" based on FY 2022 reported revenue.
Q3'23 figures on this page reflect the core organic growth by end market and product. Organic growth is reported revenue growth excluding
the impacts from changes in foreign currency exchange rates. Core organic growth is organic growth net of COVID-19 impact.
% OF
TOTAL SALES
~40%
~40%
~10%
~10%
Q3'23
-LDD
-HSD
+MSD
-HSD
7View entire presentation