AMD Results Presentation Deck slide image

AMD Results Presentation Deck

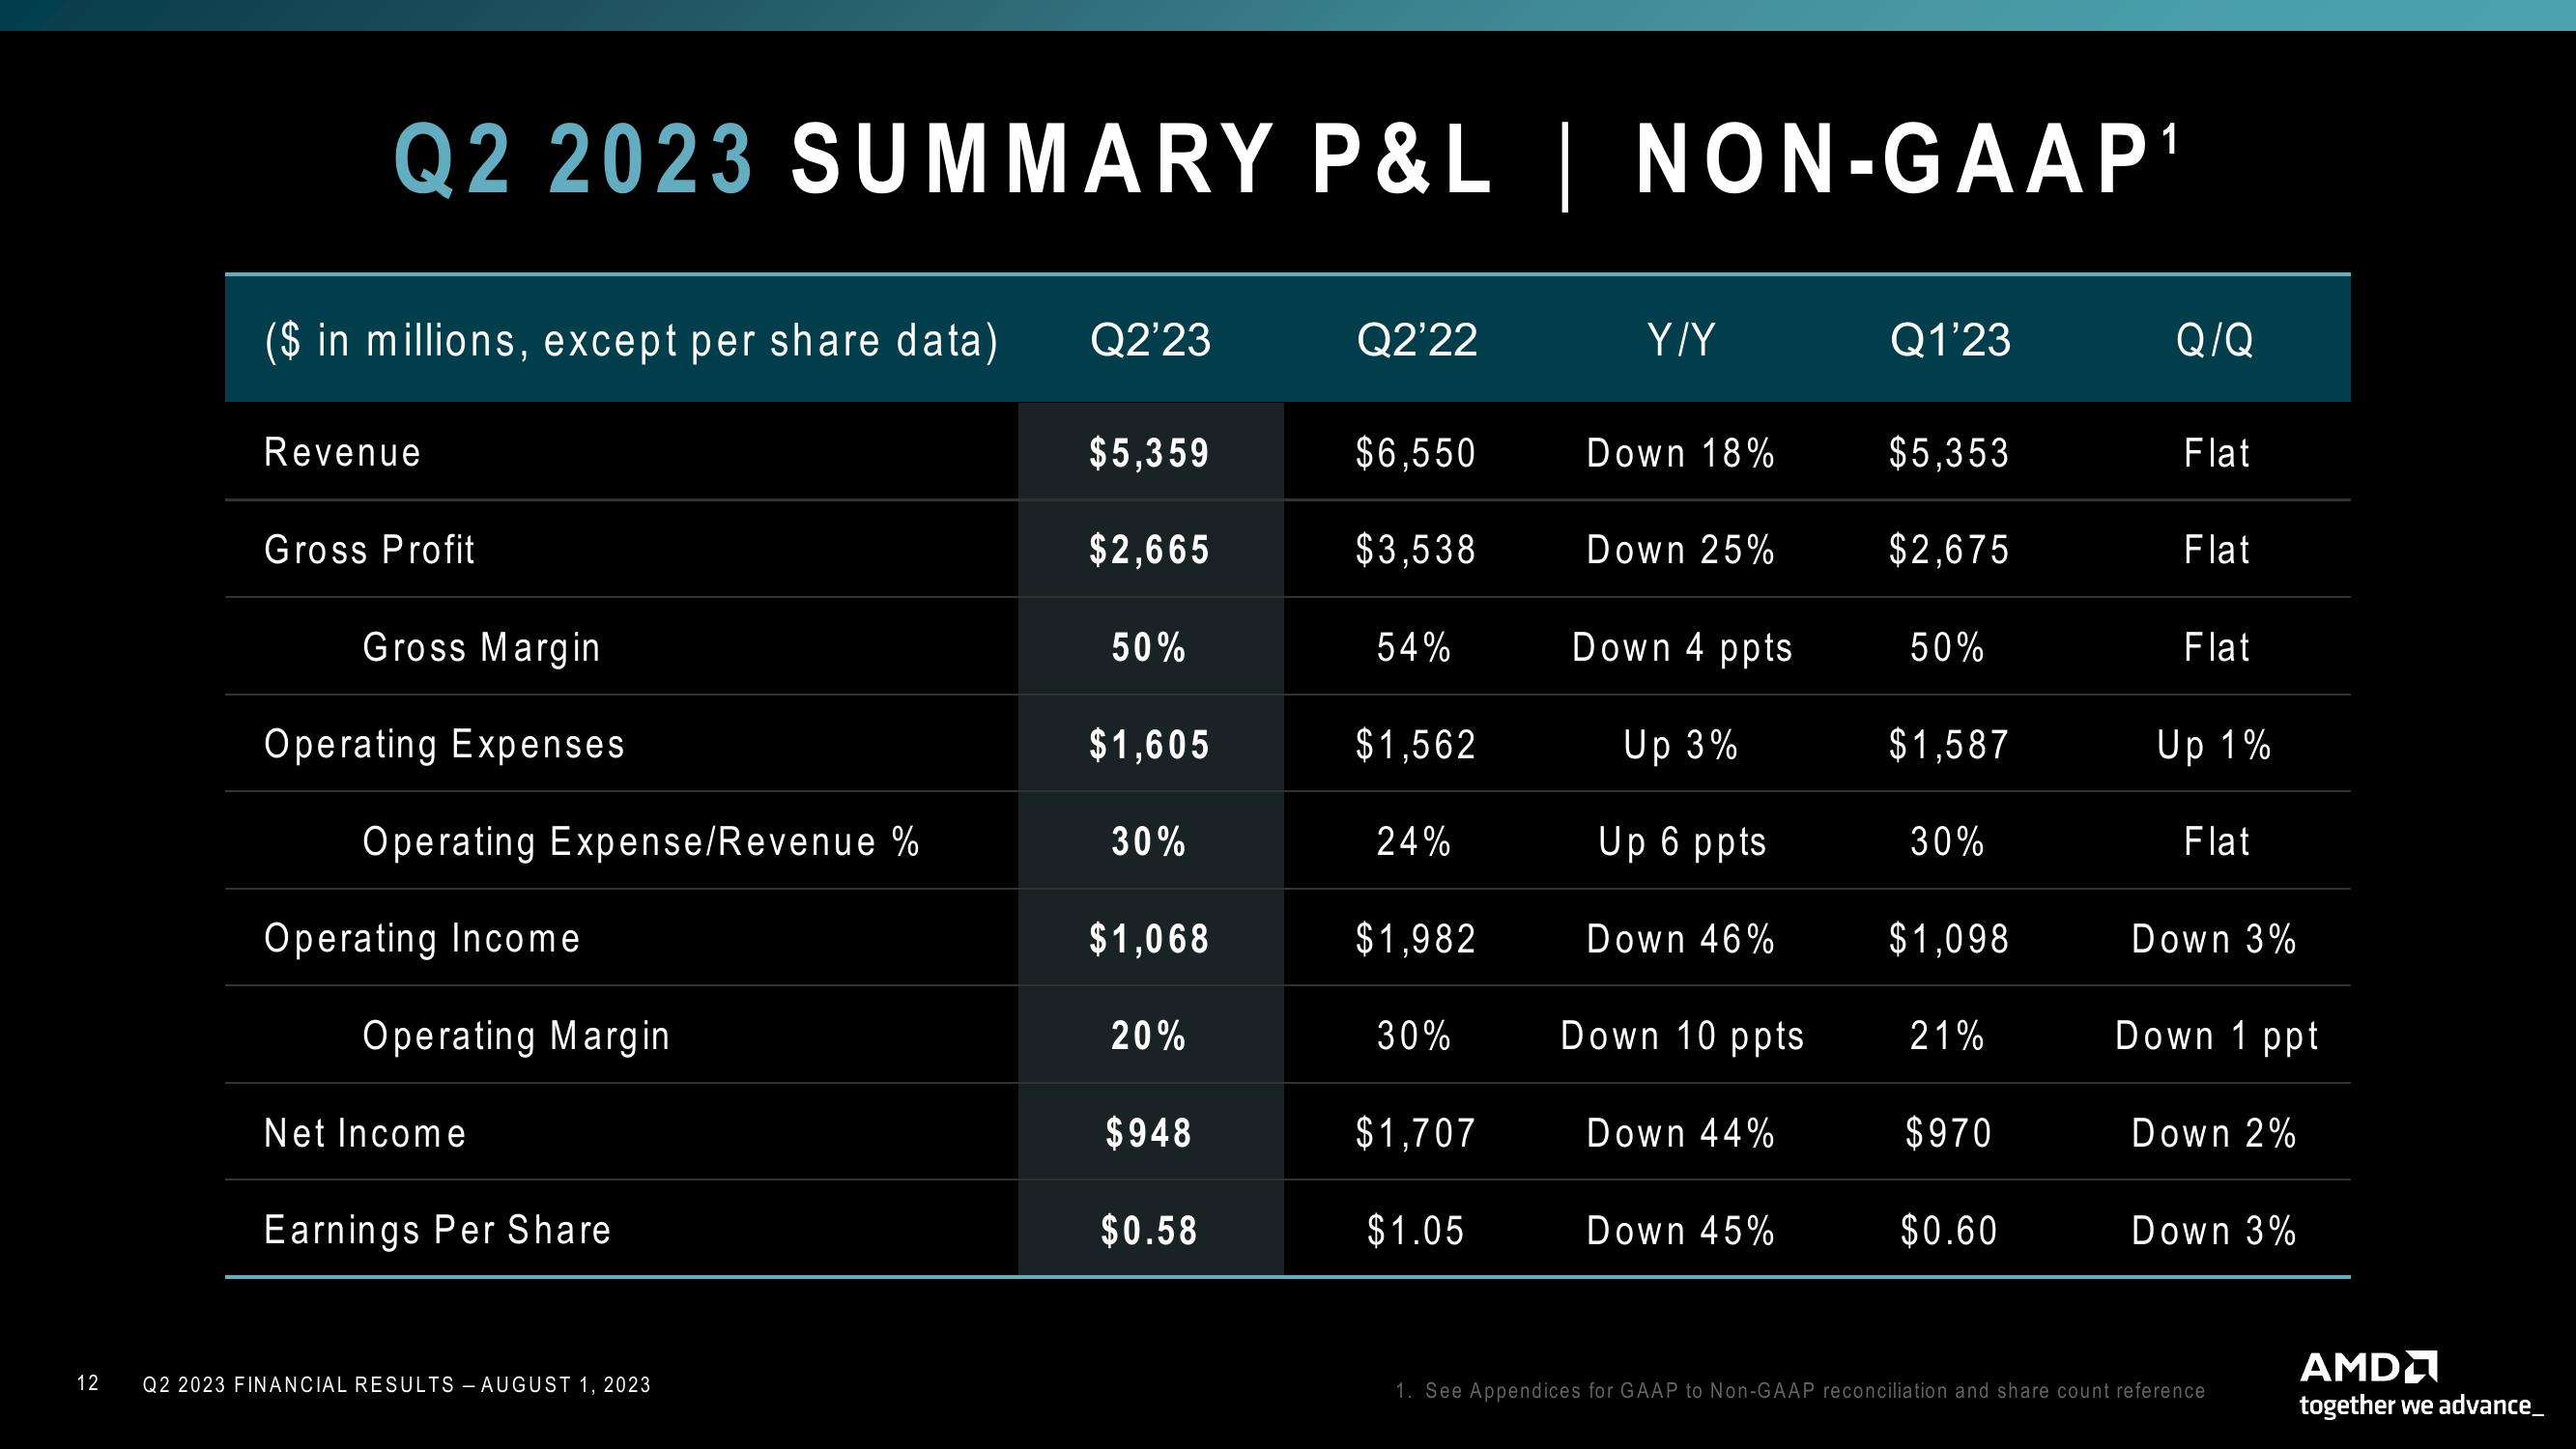
12 Q2 2023 SUMMARY P&L | NON-GAAP¹ ($ in millions, except per share data) Revenue Gross Profit Gross Margin Operating Expenses Operating Expense/Revenue % Operating Income Operating Margin Net Income Earnings Per Share Q2 2023 FINANCIAL RESULTS - AUGUST 1, 2023 Q2'23 $5,359 $2,665 50% $1,605 30% $1.068 20% $948 $0.58 Q2'22 $6,550 $3,538 54% $1.562 24% $1.982 30% $1,707 $1.05 Y/Y Down 18% Down 25% Down 4 ppts Up 3% Up 6 ppts Down 46% Down 10 ppts Down 44% Down 45% Q1'23 $5,353 $2,675 50% $1,587 30% $1.098 21% $970 $0.60 Q/Q Flat Flat Flat Up 1% Flat Down 3% Down 1 ppt Down 2% Down 3% 1. See Appendices for GAAP to Non-GAAP reconciliation and share count reference AMD together we advance_
View entire presentation