AngloAmerican Results Presentation Deck
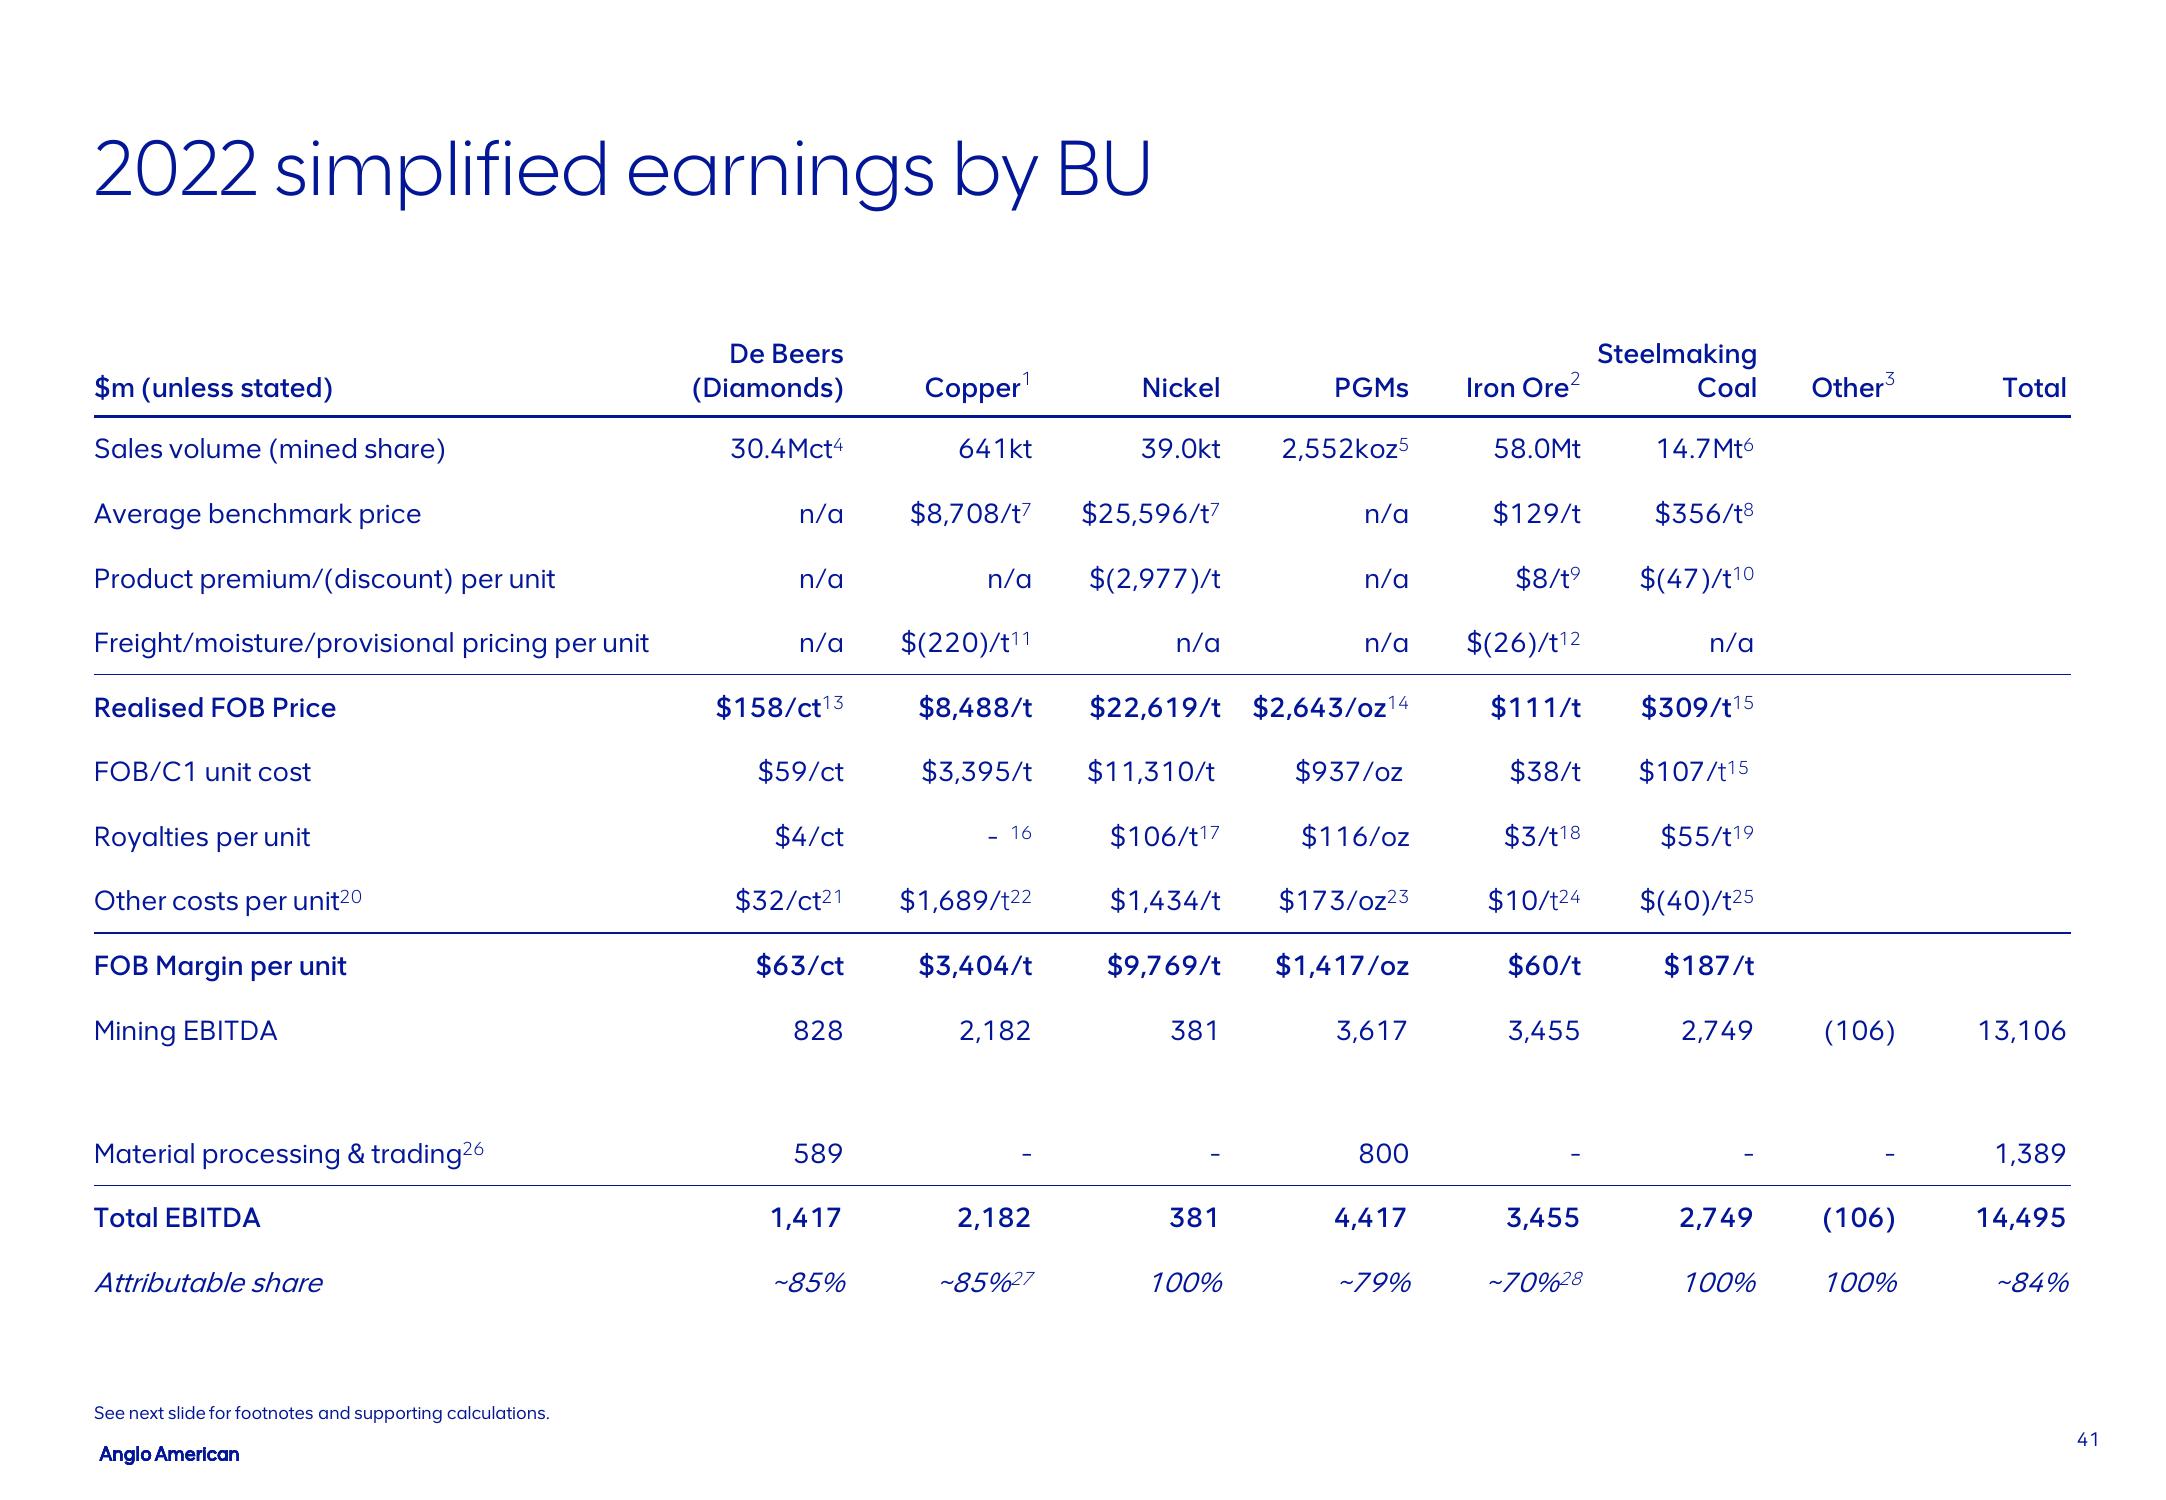
2022 simplified earnings by BU
$m (unless stated)
Sales volume (mined share)
Average benchmark price
Product premium/(discount) per unit
Freight/moisture/provisional
Realised FOB Price
FOB/C1 unit cost
Royalties per unit
Other costs per unit20
FOB Margin per unit
Mining EBITDA
Material processing & trading26
Total EBITDA
pricing per unit
Attributable share
See next slide for footnotes and supporting calculations.
Anglo American
De Beers
(Diamonds)
30.4Mct4
n/a
n/a
n/a
$158/ct13
$59/ct
$4/ct
$32/ct²1
$63/ct
828
589
1,417
~85%
Copper¹
641kt
$8,708/t7
n/a
- 16
$1,689/122
$3,404/t
2,182
2,182
Nickel
~85%27
39.Okt
$25,596/t7
$(2,977)/t
$(220)/t¹1
$8,488/t $22,619/t $2,643/oz¹4
$3,395/t
$937/oz
$11,310/t
$106/t17
$116/oz
$1,434/t $173/0z23
$9,769/t
$1,417/oz
n/a
381
381
PGMs
100%
2,552koz5
n/a
n/a
3,617
800
4,417
Iron Ore²
~79%
58.0Mt
$129/t
$8/t⁹
n/a $(26)/t12
$111/t
$38/t
$3/t18
$55/t19
$10/124 $(40)/t25
$60/t
$187/t
2,749
3,455
3,455
Steelmaking
~70%28
Coal Other³ Total
14.7Mt6
$356/t8
$(47)/t10
n/a
$309/t15
$107/t15
2,749
100%
(106)
(106)
100%
13,106
1,389
14,495
~84%
41View entire presentation