Accel Entertaiment Results Presentation Deck
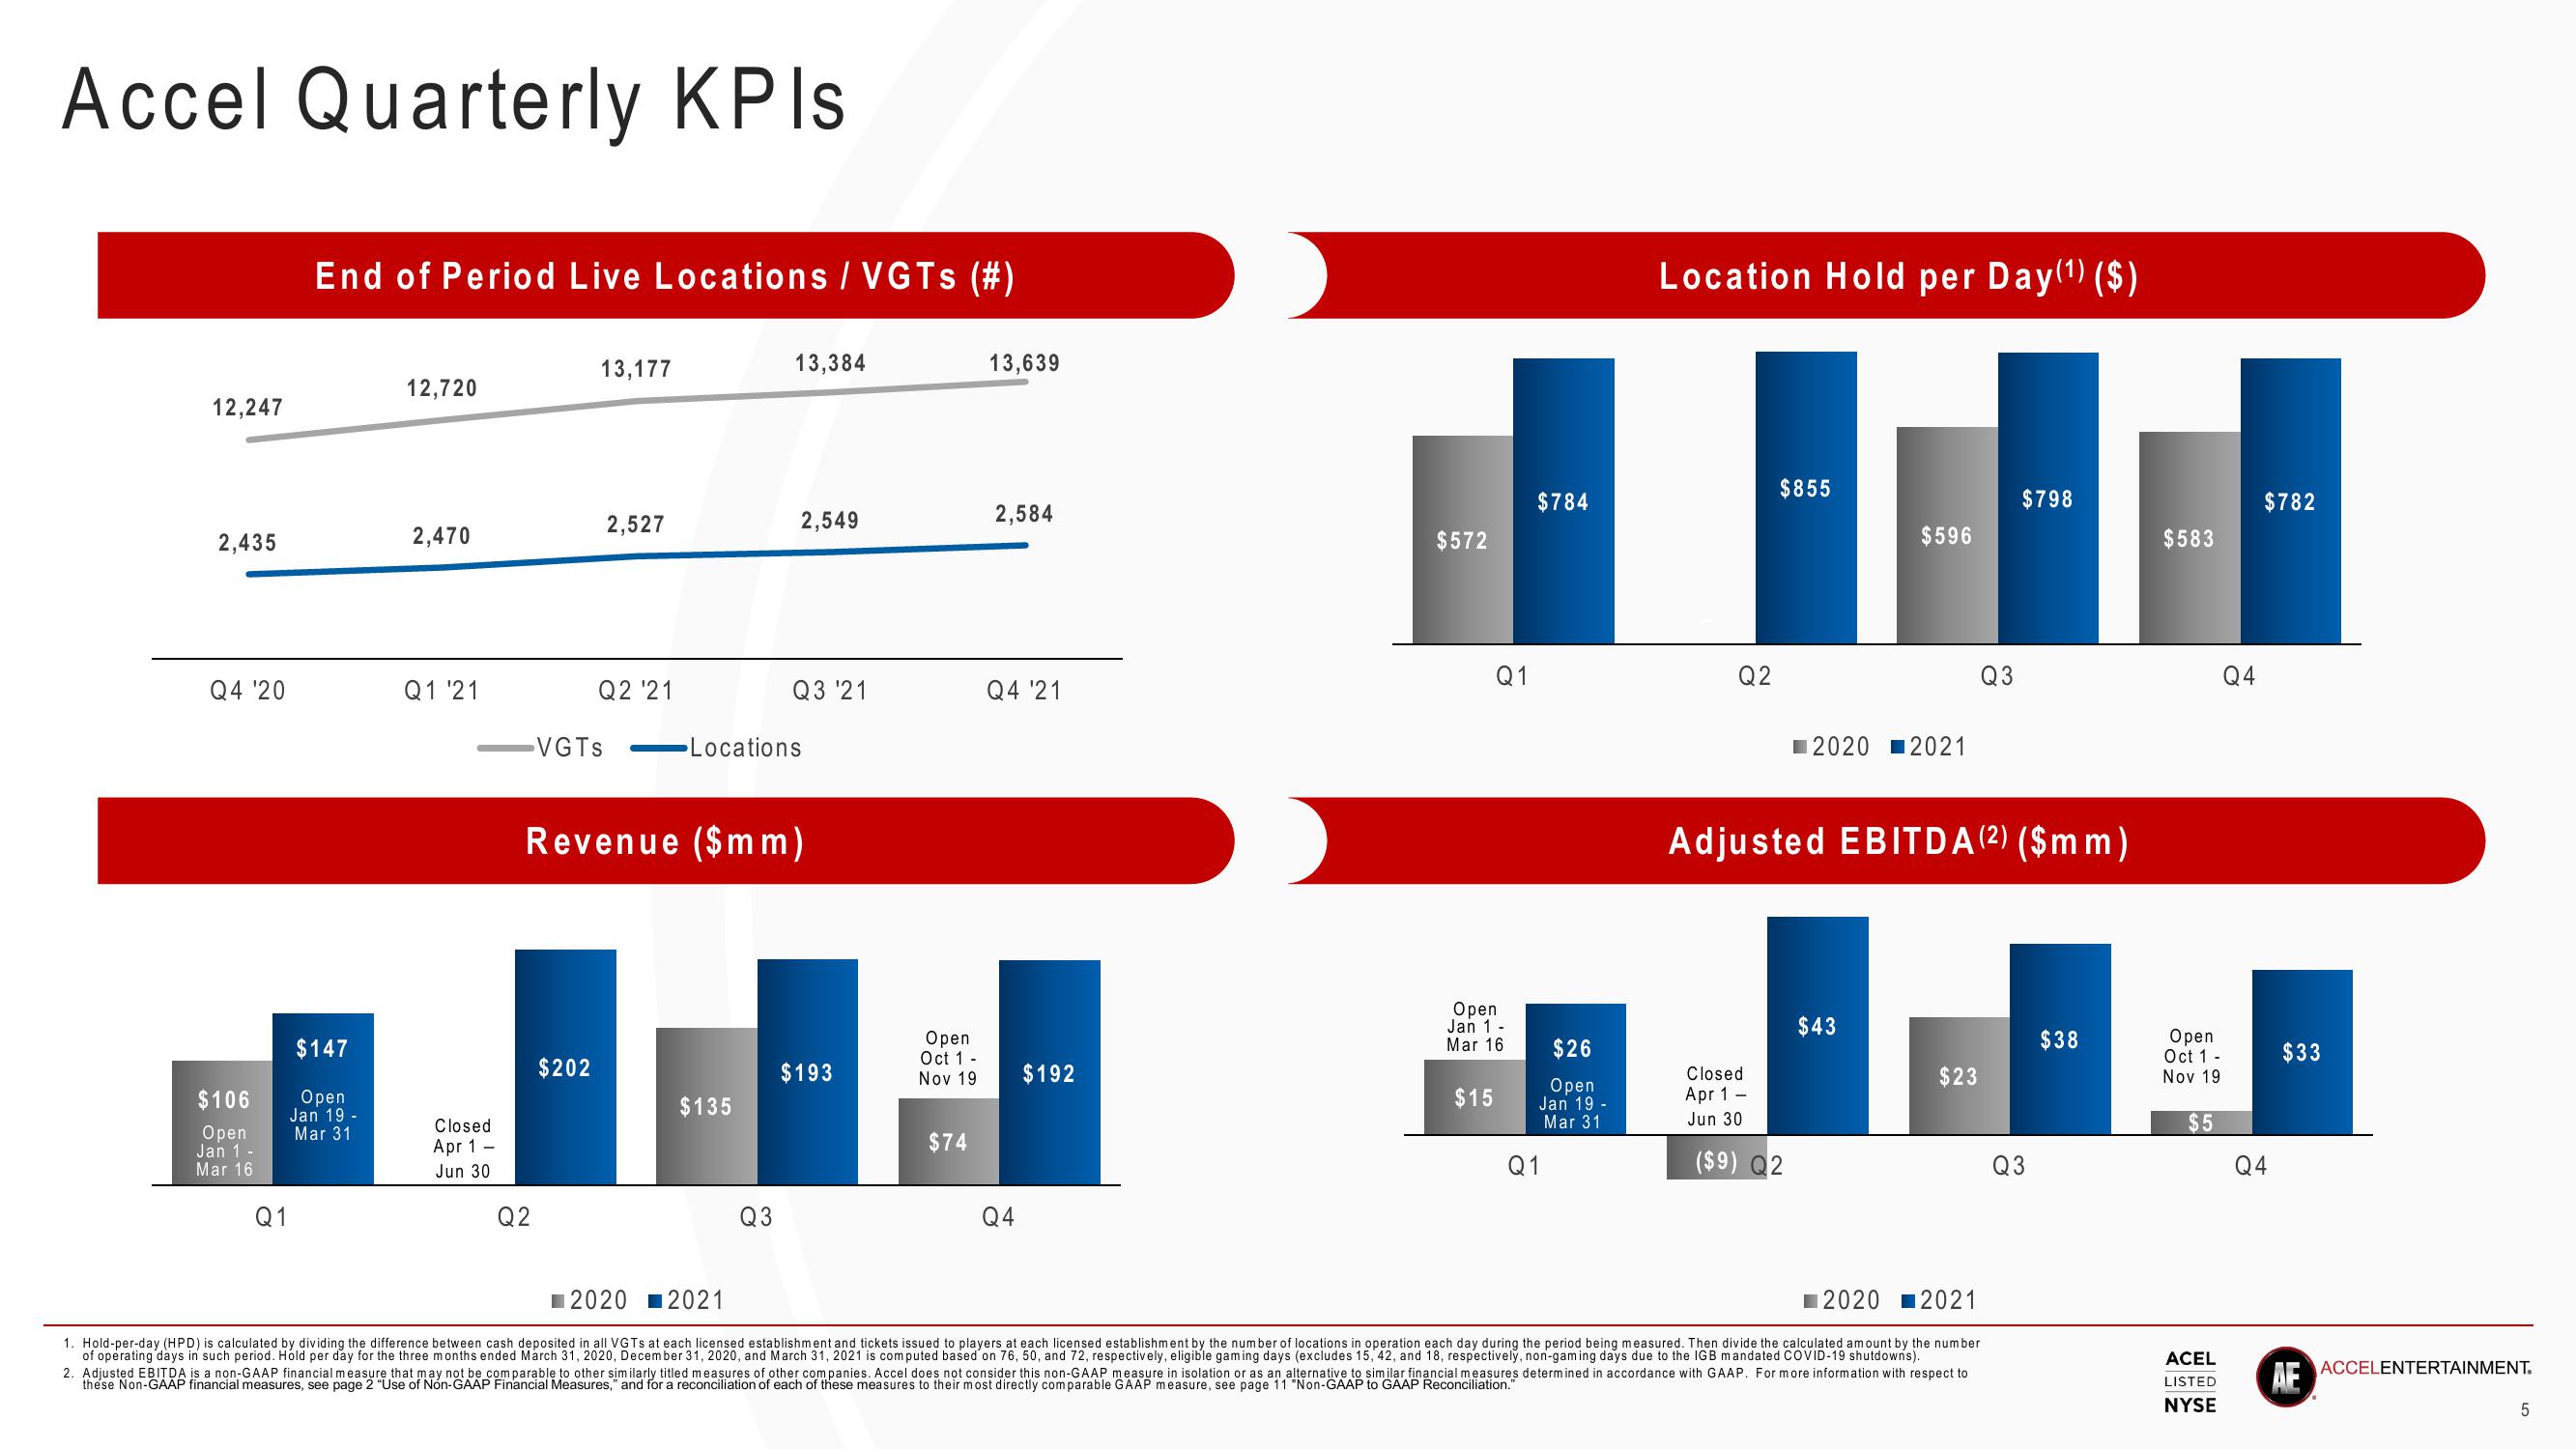
Accel Quarterly KPIs
12,247
2,435
Q4 '20
$106
Open
Jan 1 -
Mar 16
Q1
End of Period Live Locations / VGTs (#)
$147
Open
Jan 19 -
Mar 31
12,720
2,470
Q1 '21
Closed
Apr 1-
Jun 30
13,177
-VGTS
Q2
$202
2,527
Q2 '21
13,384
Revenue ($mm)
$135
2,549
Locations
Q3
Q3 '21
$193
Open
Oct 1 -
Nov 19
$74
13,639
2,584
Q4 '21
Q4
$192
$572
Q1
Open
Jan 1 -
Mar 16
$15
$784
$26
Open
Jan 19 -
Mar 31
Q1
Location Hold per Day (¹) ($)
Q2
$855
Closed
Apr 1-
Jun 30
($9) Q2
$596
2020 2021
Adjusted EBITDA (²) ($mm)
$43
Q3
$23
$798
2020
2021
2020 2021
1. Hold-per-day (HPD) is calculated by dividing the difference between cash deposited in all VGTs at each licensed establishment and tickets issued to players at each licensed establishment by the number of locations in operation each day during the period being measured. Then divide the calculated amount by the number
of operating days in such period. Hold per day for the three months ended March 31, 2020, December 31, 2020, and March 31, 2021 is computed based on 76, 50, and 72, respectively, eligible gaming days (excludes 15, 42, and 18, respectively, non-gaming days due to the IGB mandated COVID-19 shutdowns).
2. Adjusted EBITDA is a non-GAAP financial measure that may not be comparable to other similarly titled measures of other companies. Accel does not consider this non-GAAP measure in isolation or as an alternative to similar financial measures determined in accordance with GAAP. For more information with respect to
these Non-GAAP financial measures, see page 2 "Use of Non-GAAP Financial Measures," and for a reconciliation of each of these measures to their most directly comparable GAAP measure, see page 11 "Non-GAAP to GAAP Reconciliation."
Q3
$38
$583
Open
Oct 1 -
Nov 19
$5
ACEL
LISTED
NYSE
Q4
$782
Q4
$33
AE
ACCELENTERTAINMENT.
5View entire presentation