Wix Results Presentation Deck
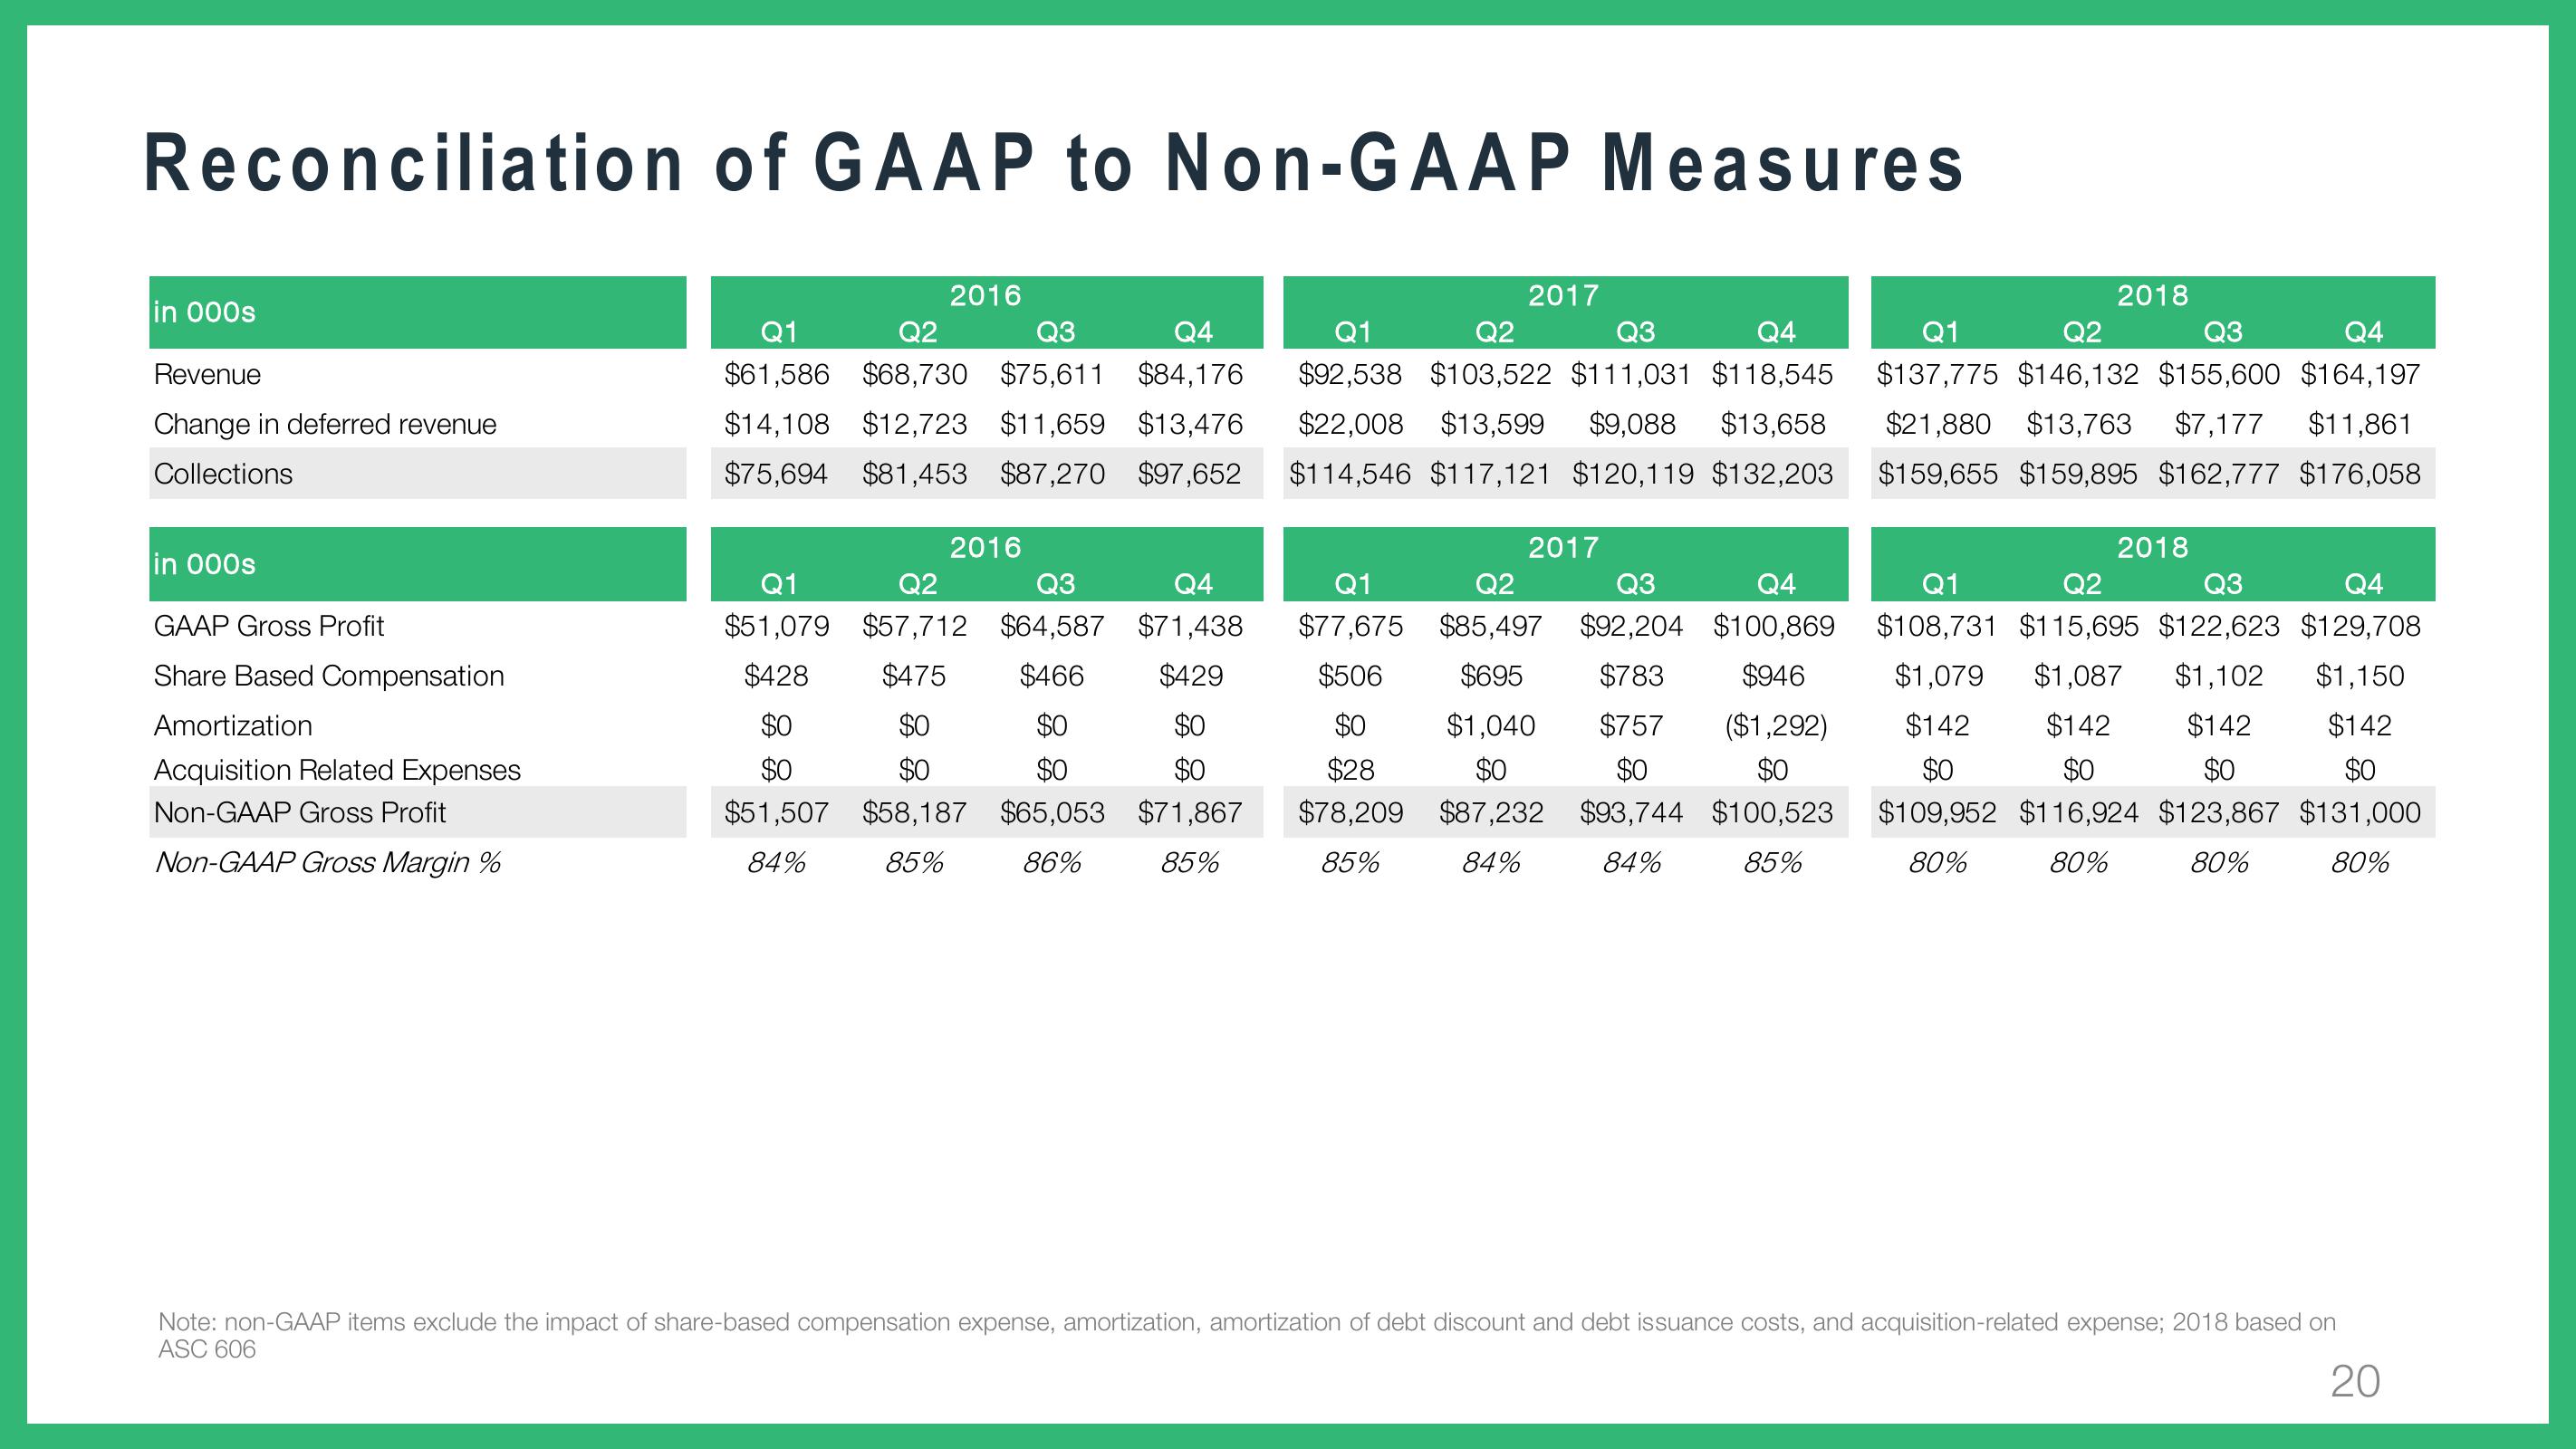
Reconciliation of GAAP to Non-GAAP Measures
in 000s
Revenue
Change in deferred revenue
Collections
in 000s
GAAP Gross Profit
Share Based Compensation
Amortization
Acquisition Related Expenses
Non-GAAP Gross Profit
Non-GAAP Gross Margin %
2016
Q4
Q1
Q2
Q3
$61,586 $68,730 $75,611 $84,176
$14,108 $12,723 $11,659 $13,476
$75,694 $81,453 $87,270 $97,652
2016
2017
Q1
Q4
Q2
Q3
$92,538 $103,522 $111,031 $118,545
$22,008 $13,599 $9,088 $13,658
$114,546 $117,121 $120,119 $132,203
2017
Q4
Q1
Q2
$51,079 $57,712 $64,587 $71,438
$466 $429
$428
$475
Q1
Q2
Q3
Q4
$77,675 $85,497 $92,204 $100,869
$506 $695 $783 $946
$0 $1,040 $757 ($1,292)
$0
$0
$0
$0
$28
$0
$0
$0
$51,507 $58,187 $65,053 $71,867 $78,209 $87,232 $93,744 $100,523
84%
85%
84%
$0
$0
$0
$0
86%
85%
85%
84%
85%
2018
Q4
Q1
Q2
Q3
$137,775 $146,132 $155,600 $164,197
$21,880 $13,763 $7,177 $11,861
$159,655 $159,895 $162,777 $176,058
2018
Q4
$129,708
$1,150
Q1
Q2
Q3
$108,731 $115,695 $122,623
$1,079 $1,087 $1,102
$142 $142 $142 $142
$0
$0
$0
$0
$109,952 $116,924 $123,867 $131,000
80%
80%
80%
80%
Note: non-GAAP items exclude the impact of share-based compensation expense, amortization, amortization of debt discount and debt issuance costs, and acquisition-related expense; 2018 based on
ASC 606
20View entire presentation