Nexters Results Presentation Deck
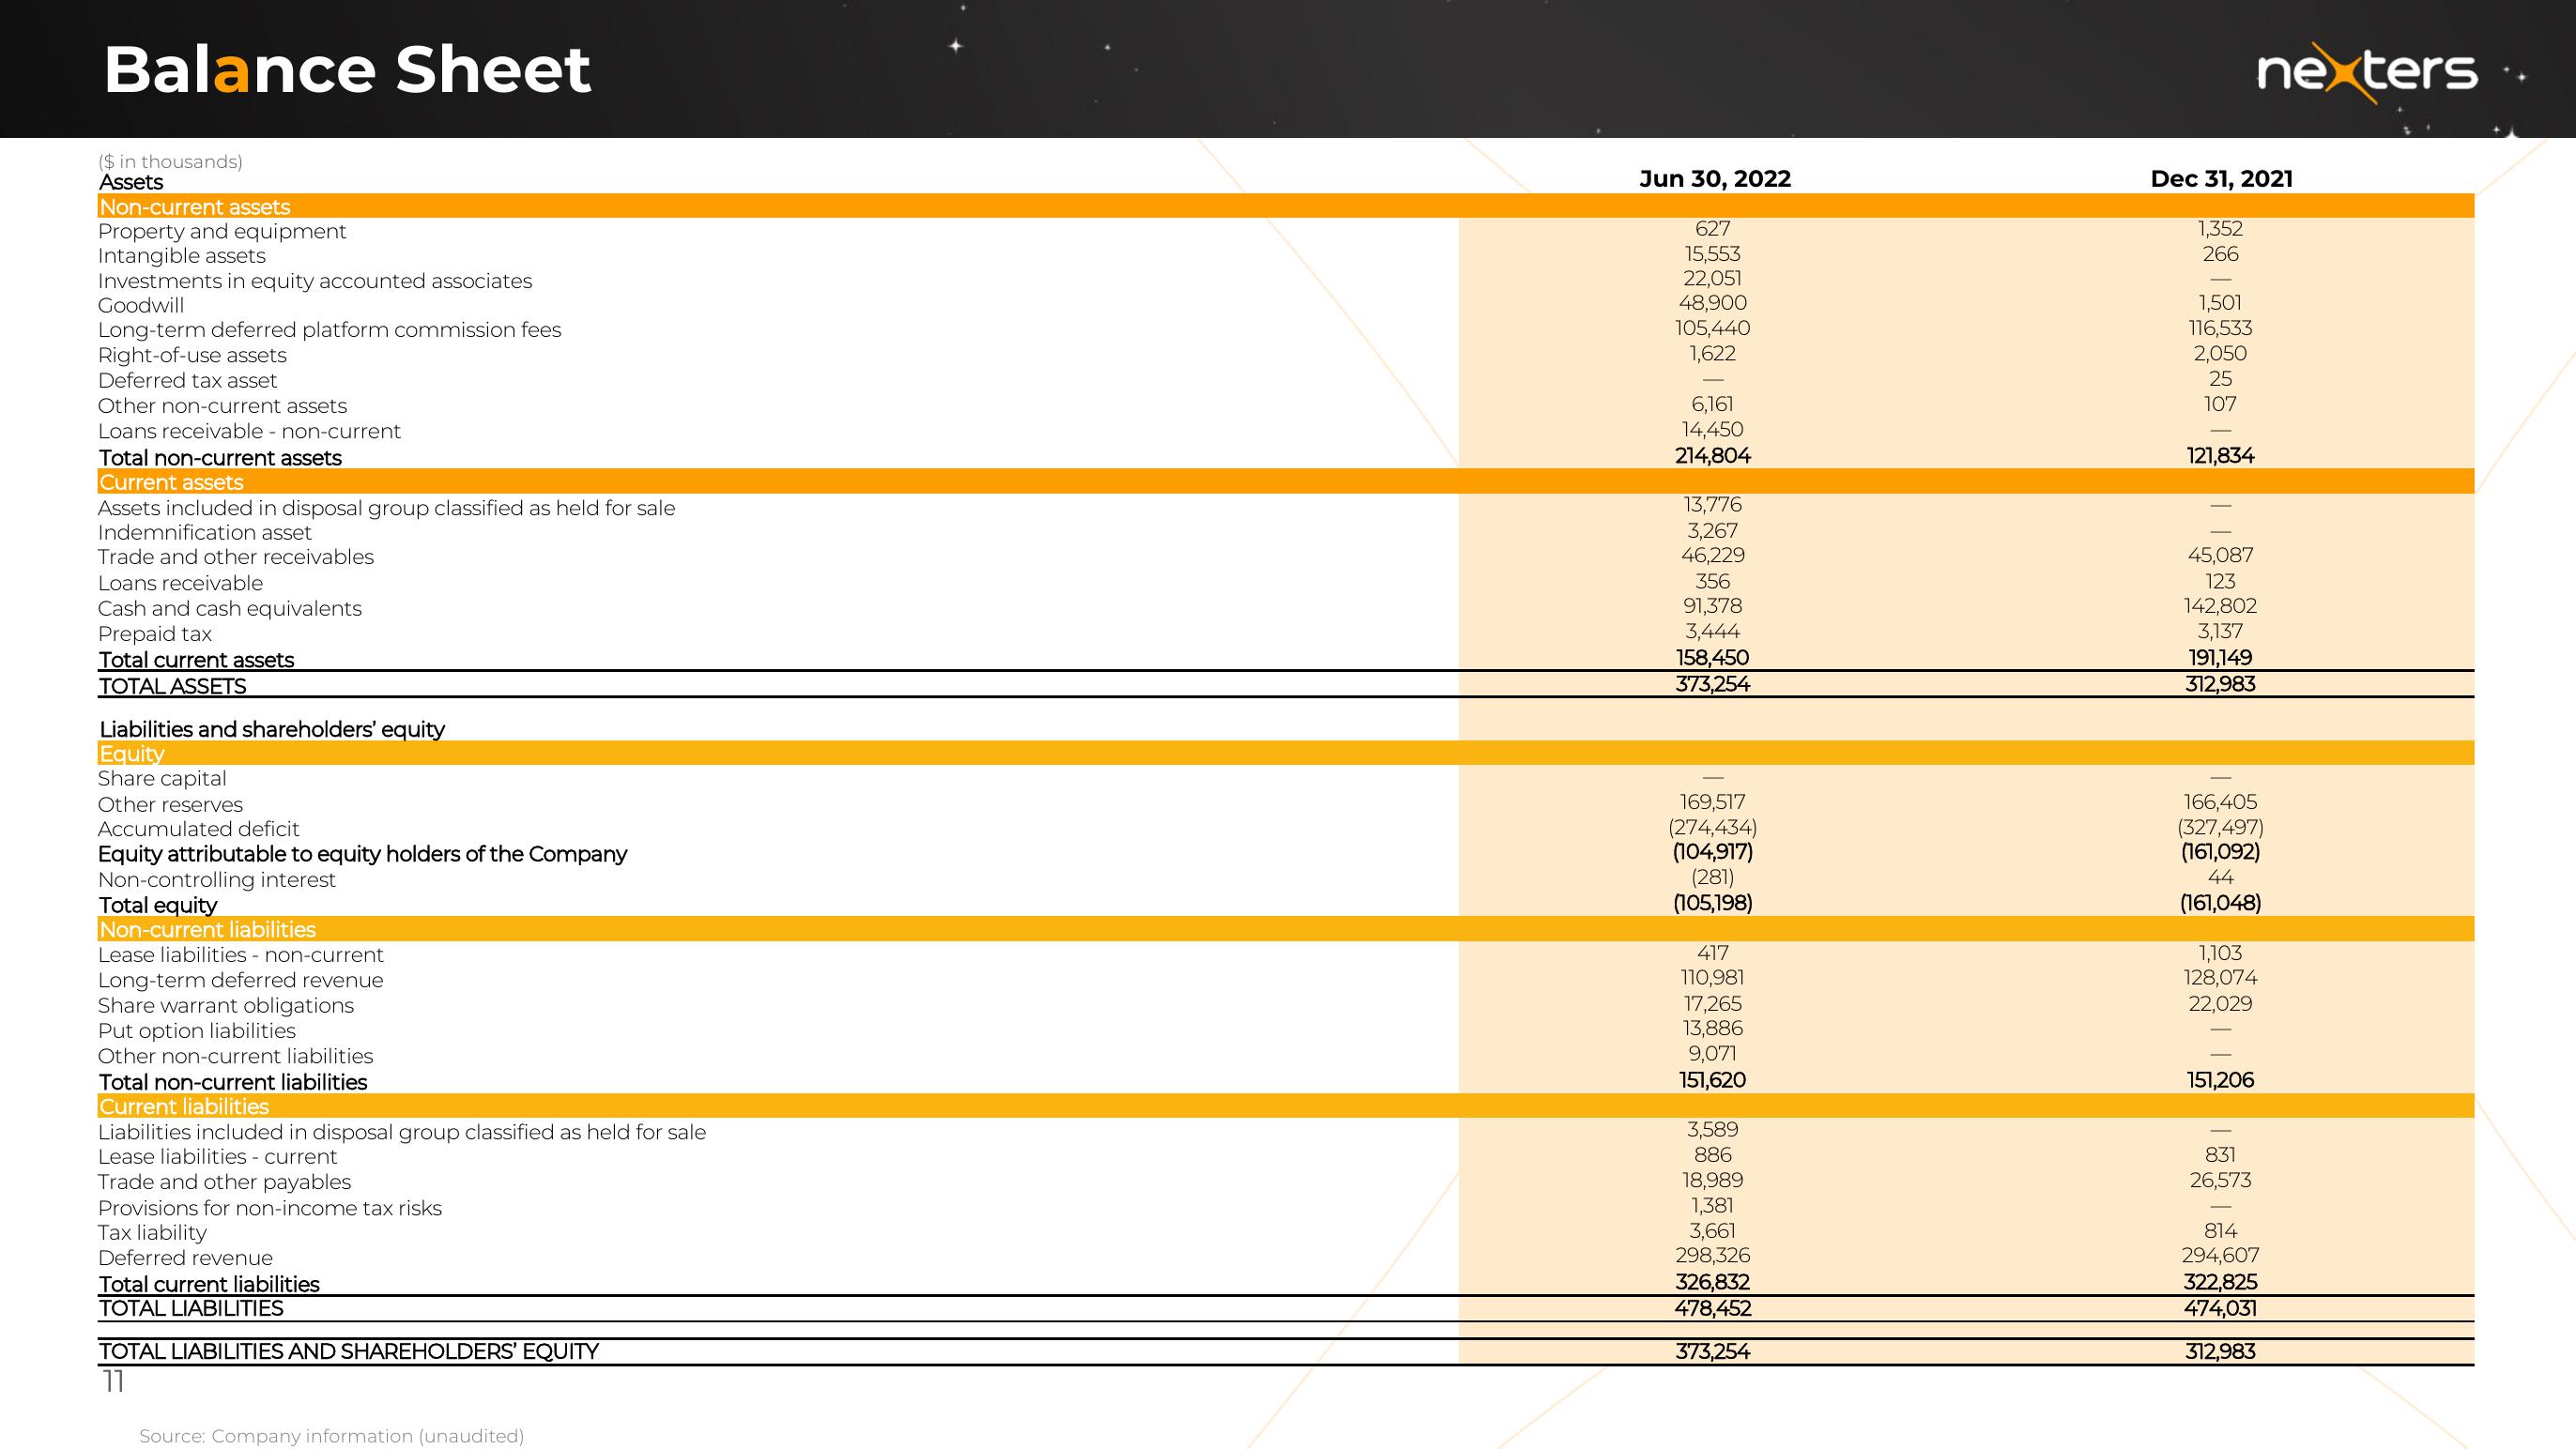
Balance Sheet
($ in thousands)
Assets
Non-current assets
Property and equipment
Intangible assets
Investments in equity accounted associates
Goodwill
Long-term deferred platform commission fees
Right-of-use assets
Deferred tax asset
Other non-current assets
Loans receivable - non-current
Total non-current assets
Current assets
Assets included in disposal group classified as held for sale
Indemnification asset
Trade and other receivables
Loans receivable
Cash and cash equivalents
Prepaid tax
Total current assets
TOTAL ASSETS
Liabilities and shareholders' equity
Equity
Share capital
Other reserves
Accumulated deficit
Equity attributable to equity holders of the Company
Non-controlling interest
Total equity
Non-current liabilities
Lease liabilities - non-current
Long-term deferred revenue
Share warrant obligations
Put option liabilities
Other non-current liabilities.
Total non-current liabilities
Current liabilities
Liabilities included in disposal group classified as held for sale
Lease liabilities - current
Trade and other payables
Provisions for non-income tax risks
Tax liability
Deferred revenue
Total current liabilities
TOTAL LIABILITIES
TOTAL LIABILITIES AND SHAREHOLDERS' EQUITY
11
Source: Company information (unaudited)
Jun 30, 2022
627
15,553
22,051
48,900
105,440
1,622
6,161
14,450
214,804
13,776
3,267
46,229
356
91,378
3,444
158,450
373,254
169,517
(274,434)
(104,917)
(281)
(105,198)
417
110,981
17,265
13,886
9,071
151,620
3,589
886
18,989
1,381
3,661
298,326
326,832
478,452
373,254
Dec 31, 2021
1,352
266
1,501
116,533
2,050
25
107
121,834
nexters
45,087
123
142,802
3,137
191,149
312,983
166,405
(327,497)
(161,092)
44
(161,048)
1,103
128,074
22,029
151,206
831
26,573
814
294,607
322,825
474,031
312,983View entire presentation