Barclays Credit Presentation Deck
STRATEGY, TARGETS
& GUIDANCE
Income
£21.9bn
FY20: £21.8bn
FY21 Group highlights
Cost: income
ratio
66%
FY20: 64%
PBT
£8.4bn
FY20: £3.1bn
ROTE
13.4%
FY20: 3.2%
PERFORMANCE
TNAV per
share
292p
Dec-20:269p
Costs
£14.4bn
FY20: £13.9bn
Impairment
£(0.7)bn
release
FY20: £4.8bn
charge
EPS
37.5p
FY20: 8.8p
CET1 ratio
15.1%
Dec-20: 15.1%
Liquidity
Coverage
Ratio
168%
Dec-20: 162%
●
16 | Barclays Q4 2021 Results | 23 February 2022
●
●
●
●
ASSET QUALITY
●
CAPITAL
& LEVERAGE
3,065
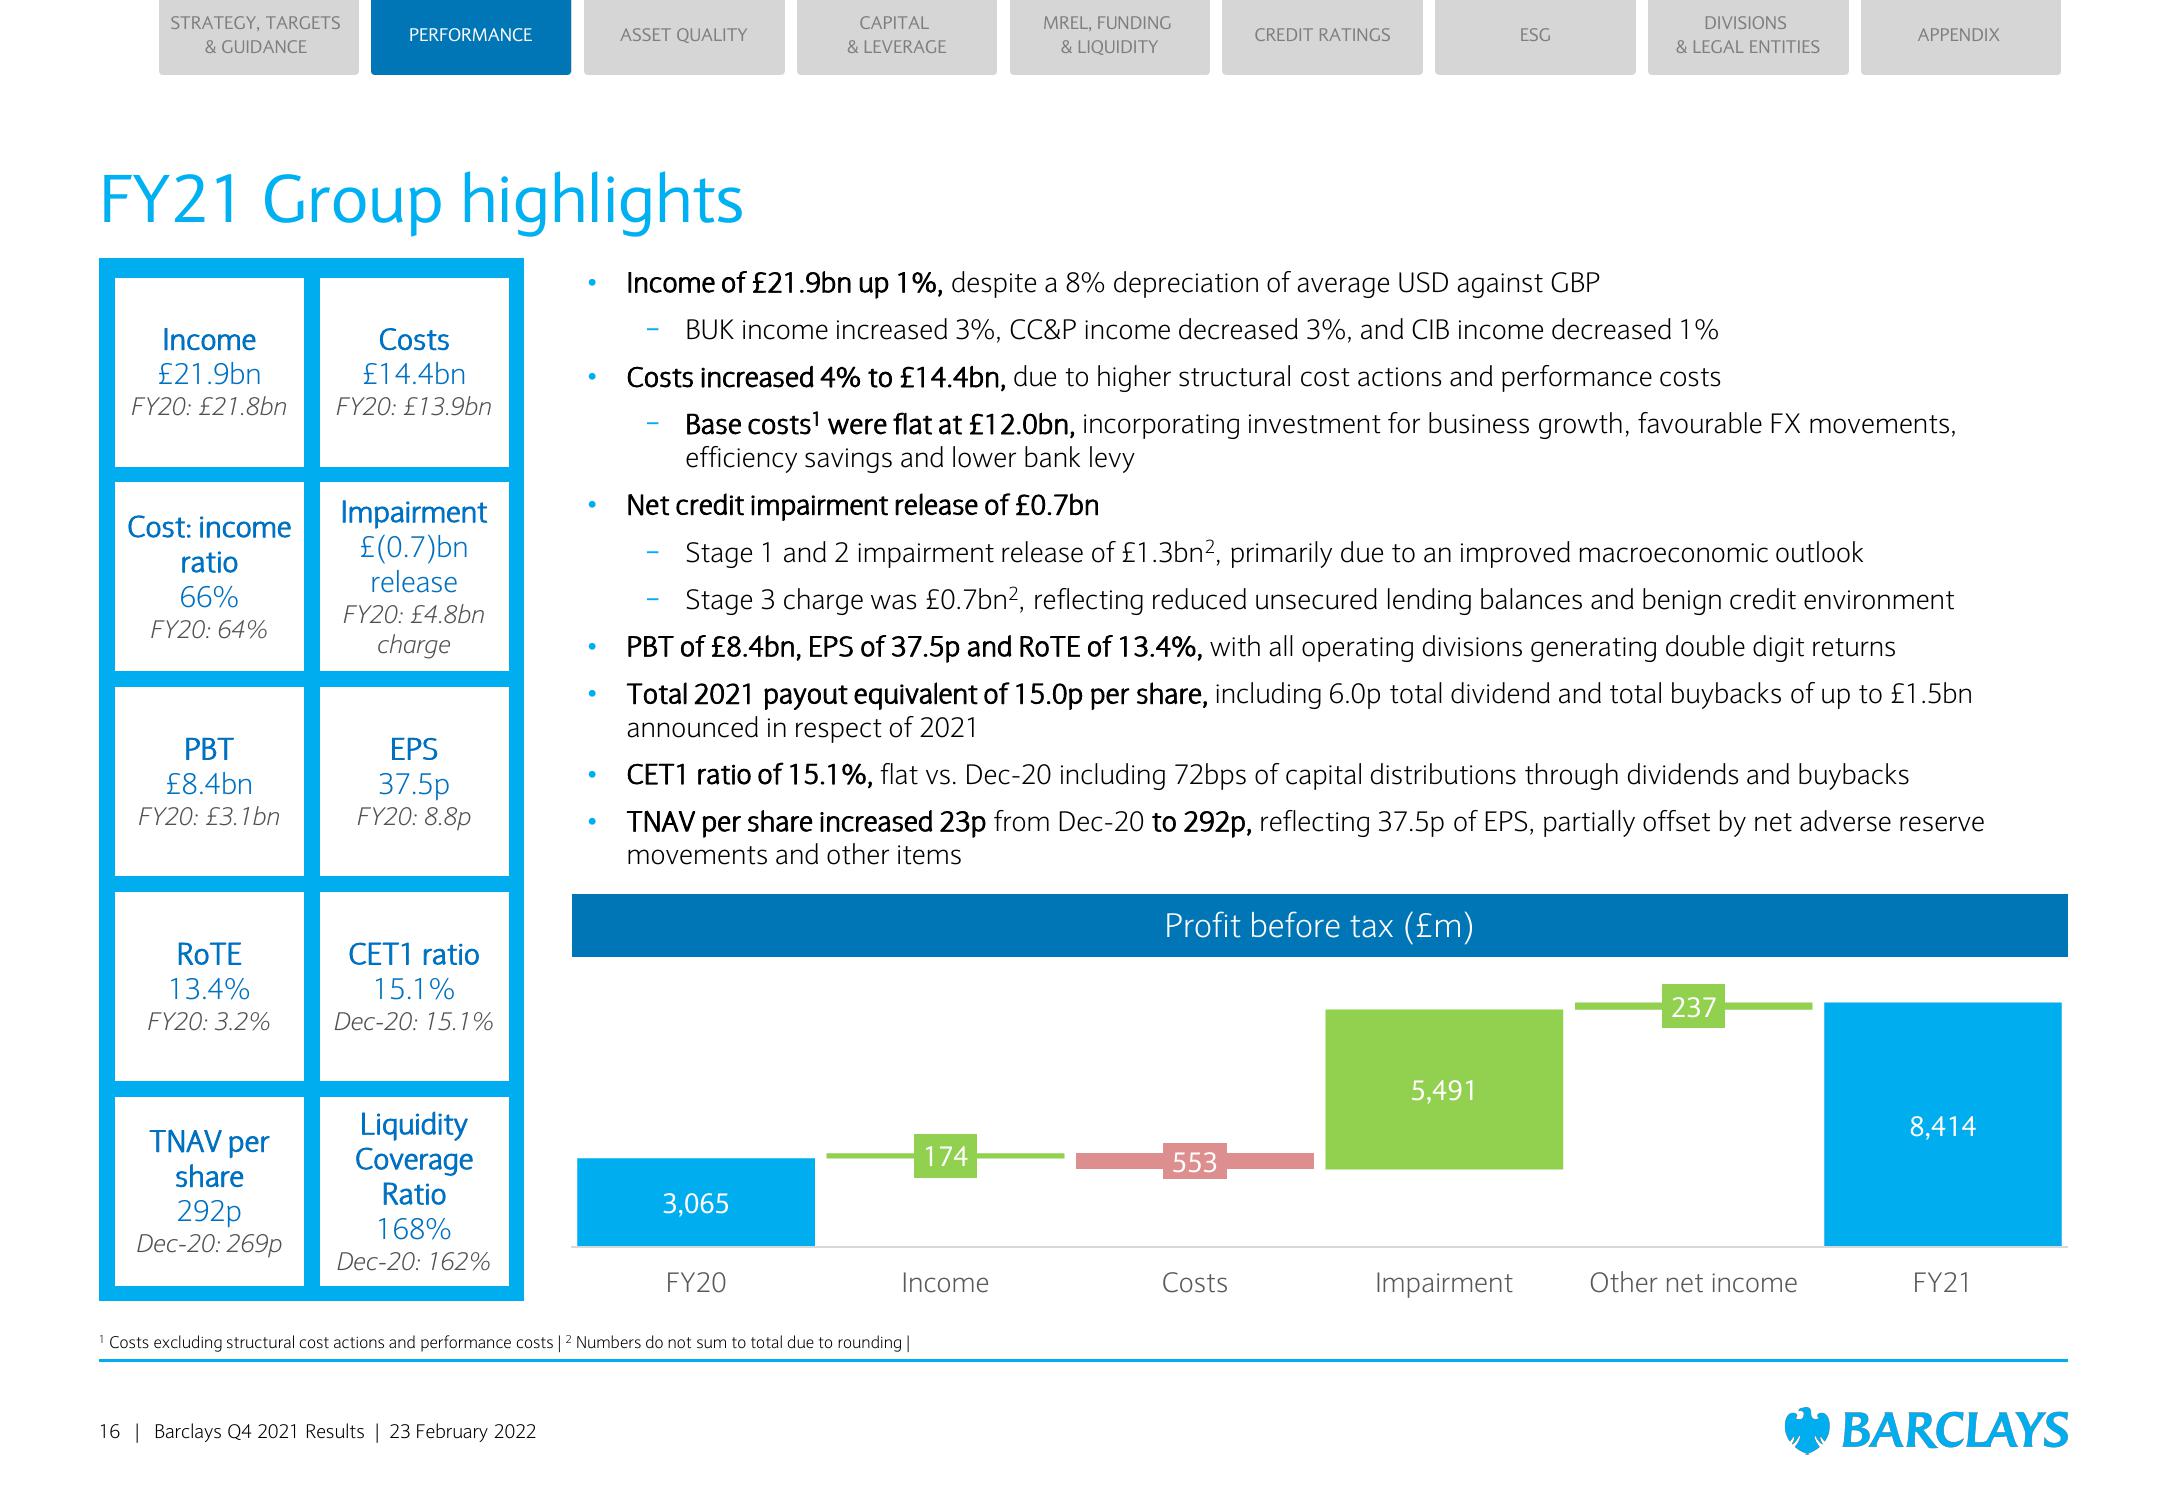
Income of £21.9bn up 1%, despite a 8% depreciation of average USD against GBP
BUK income increased 3%, CC&P income decreased 3%, and CIB income decreased 1%
FY20
MREL, FUNDING
& LIQUIDITY
Costs increased 4% to £14.4bn, due to higher structural cost actions and performance costs
Base costs¹ were flat at £12.0bn, incorporating investment for business growth, favourable FX movements,
efficiency savings and lower bank levy
¹ Costs excluding structural cost actions and performance costs | ² Numbers do not sum to total due to rounding |
Net credit impairment release of £0.7bn
Stage 1 and 2 impairment release of £1.3bn², primarily due to an improved macroeconomic outlook
Stage 3 charge was £0.7bn², reflecting reduced unsecured lending balances and benign credit environment
PBT of £8.4bn, EPS of 37.5p and ROTE of 13.4%, with all operating divisions generating double digit returns
Total 2021 payout equivalent of 15.0p per share, including 6.0p total dividend and total buybacks of up to £1.5bn
announced in respect of 2021
174
Income
CREDIT RATINGS
CET1 ratio of 15.1%, flat vs. Dec-20 including 72bps of capital distributions through dividends and buybacks
TNAV per share increased 23p from Dec-20 to 292p, reflecting 37.5p of EPS, partially offset by net adverse reserve
movements and other items
Profit before tax (£m)
553
ESG
Costs
DIVISIONS
& LEGAL ENTITIES
5,491
Impairment
APPENDIX
237
Other net income
8,414
FY21
BARCLAYSView entire presentation