AMC Investor Day Presentation Deck
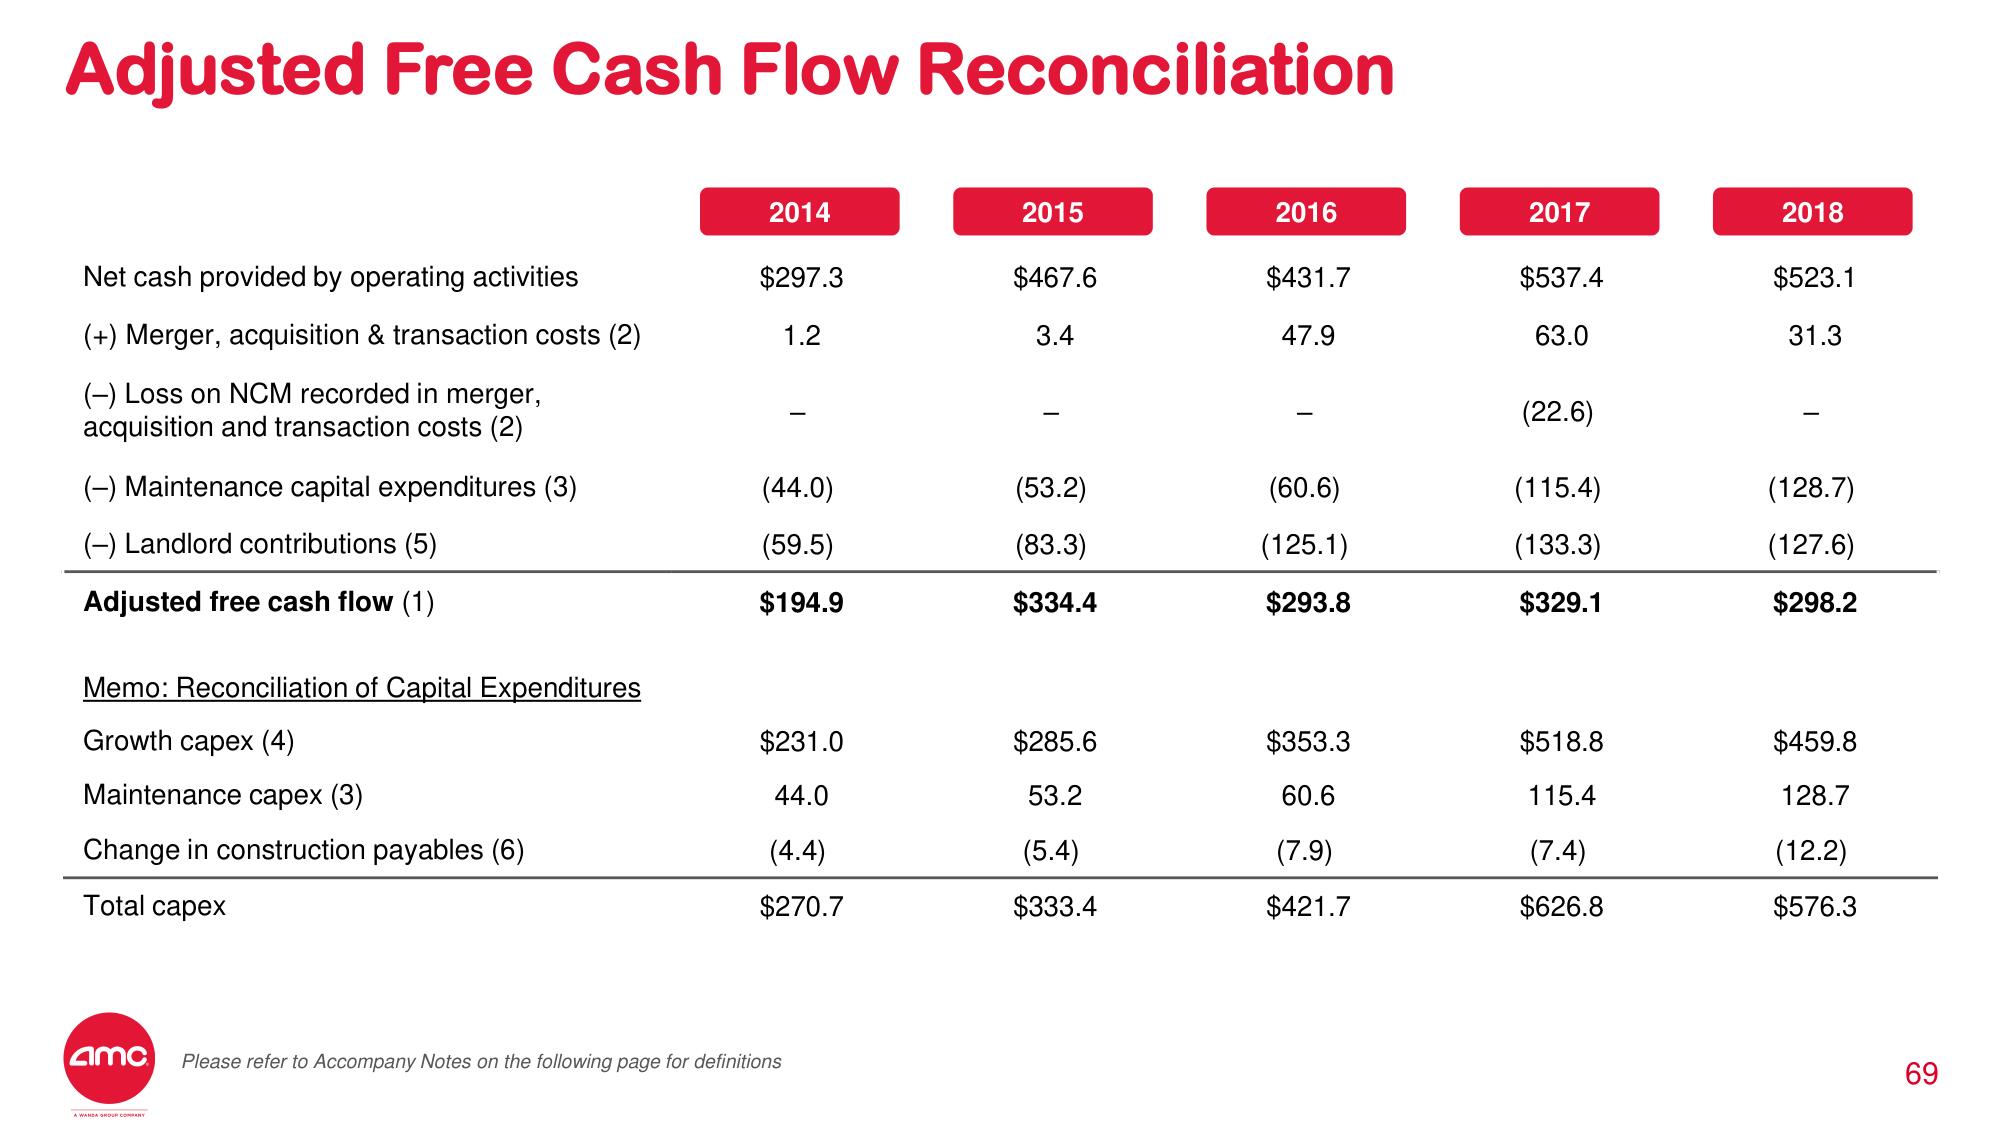
Adjusted Free Cash Flow Reconciliation
Net cash provided by operating activities
(+) Merger, acquisition & transaction costs (2)
(-) Loss on NCM recorded in merger,
acquisition and transaction costs (2)
(-) Maintenance capital expenditures (3)
(-) Landlord contributions (5)
Adjusted free cash flow (1)
Memo: Reconciliation of Capital Expenditures
Growth capex (4)
Maintenance capex (3)
Change in construction payables (6)
Total capex
amc
2014
$297.3
1.2
(44.0)
(59.5)
$194.9
$231.0
44.0
(4.4)
$270.7
Please refer to Accompany Notes on the following page for definitions
2015
$467.6
3.4
(53.2)
(83.3)
$334.4
$285.6
53.2
(5.4)
$333.4
2016
$431.7
47.9
(60.6)
(125.1)
$293.8
$353.3
60.6
(7.9)
$421.7
2017
$537.4
63.0
(22.6)
(115.4)
(133.3)
$329.1
$518.8
115.4
(7.4)
$626.8
2018
$523.1
31.3
(128.7)
(127.6)
$298.2
$459.8
128.7
(12.2)
$576.3
69View entire presentation