Consistent Progress Investor Presentation
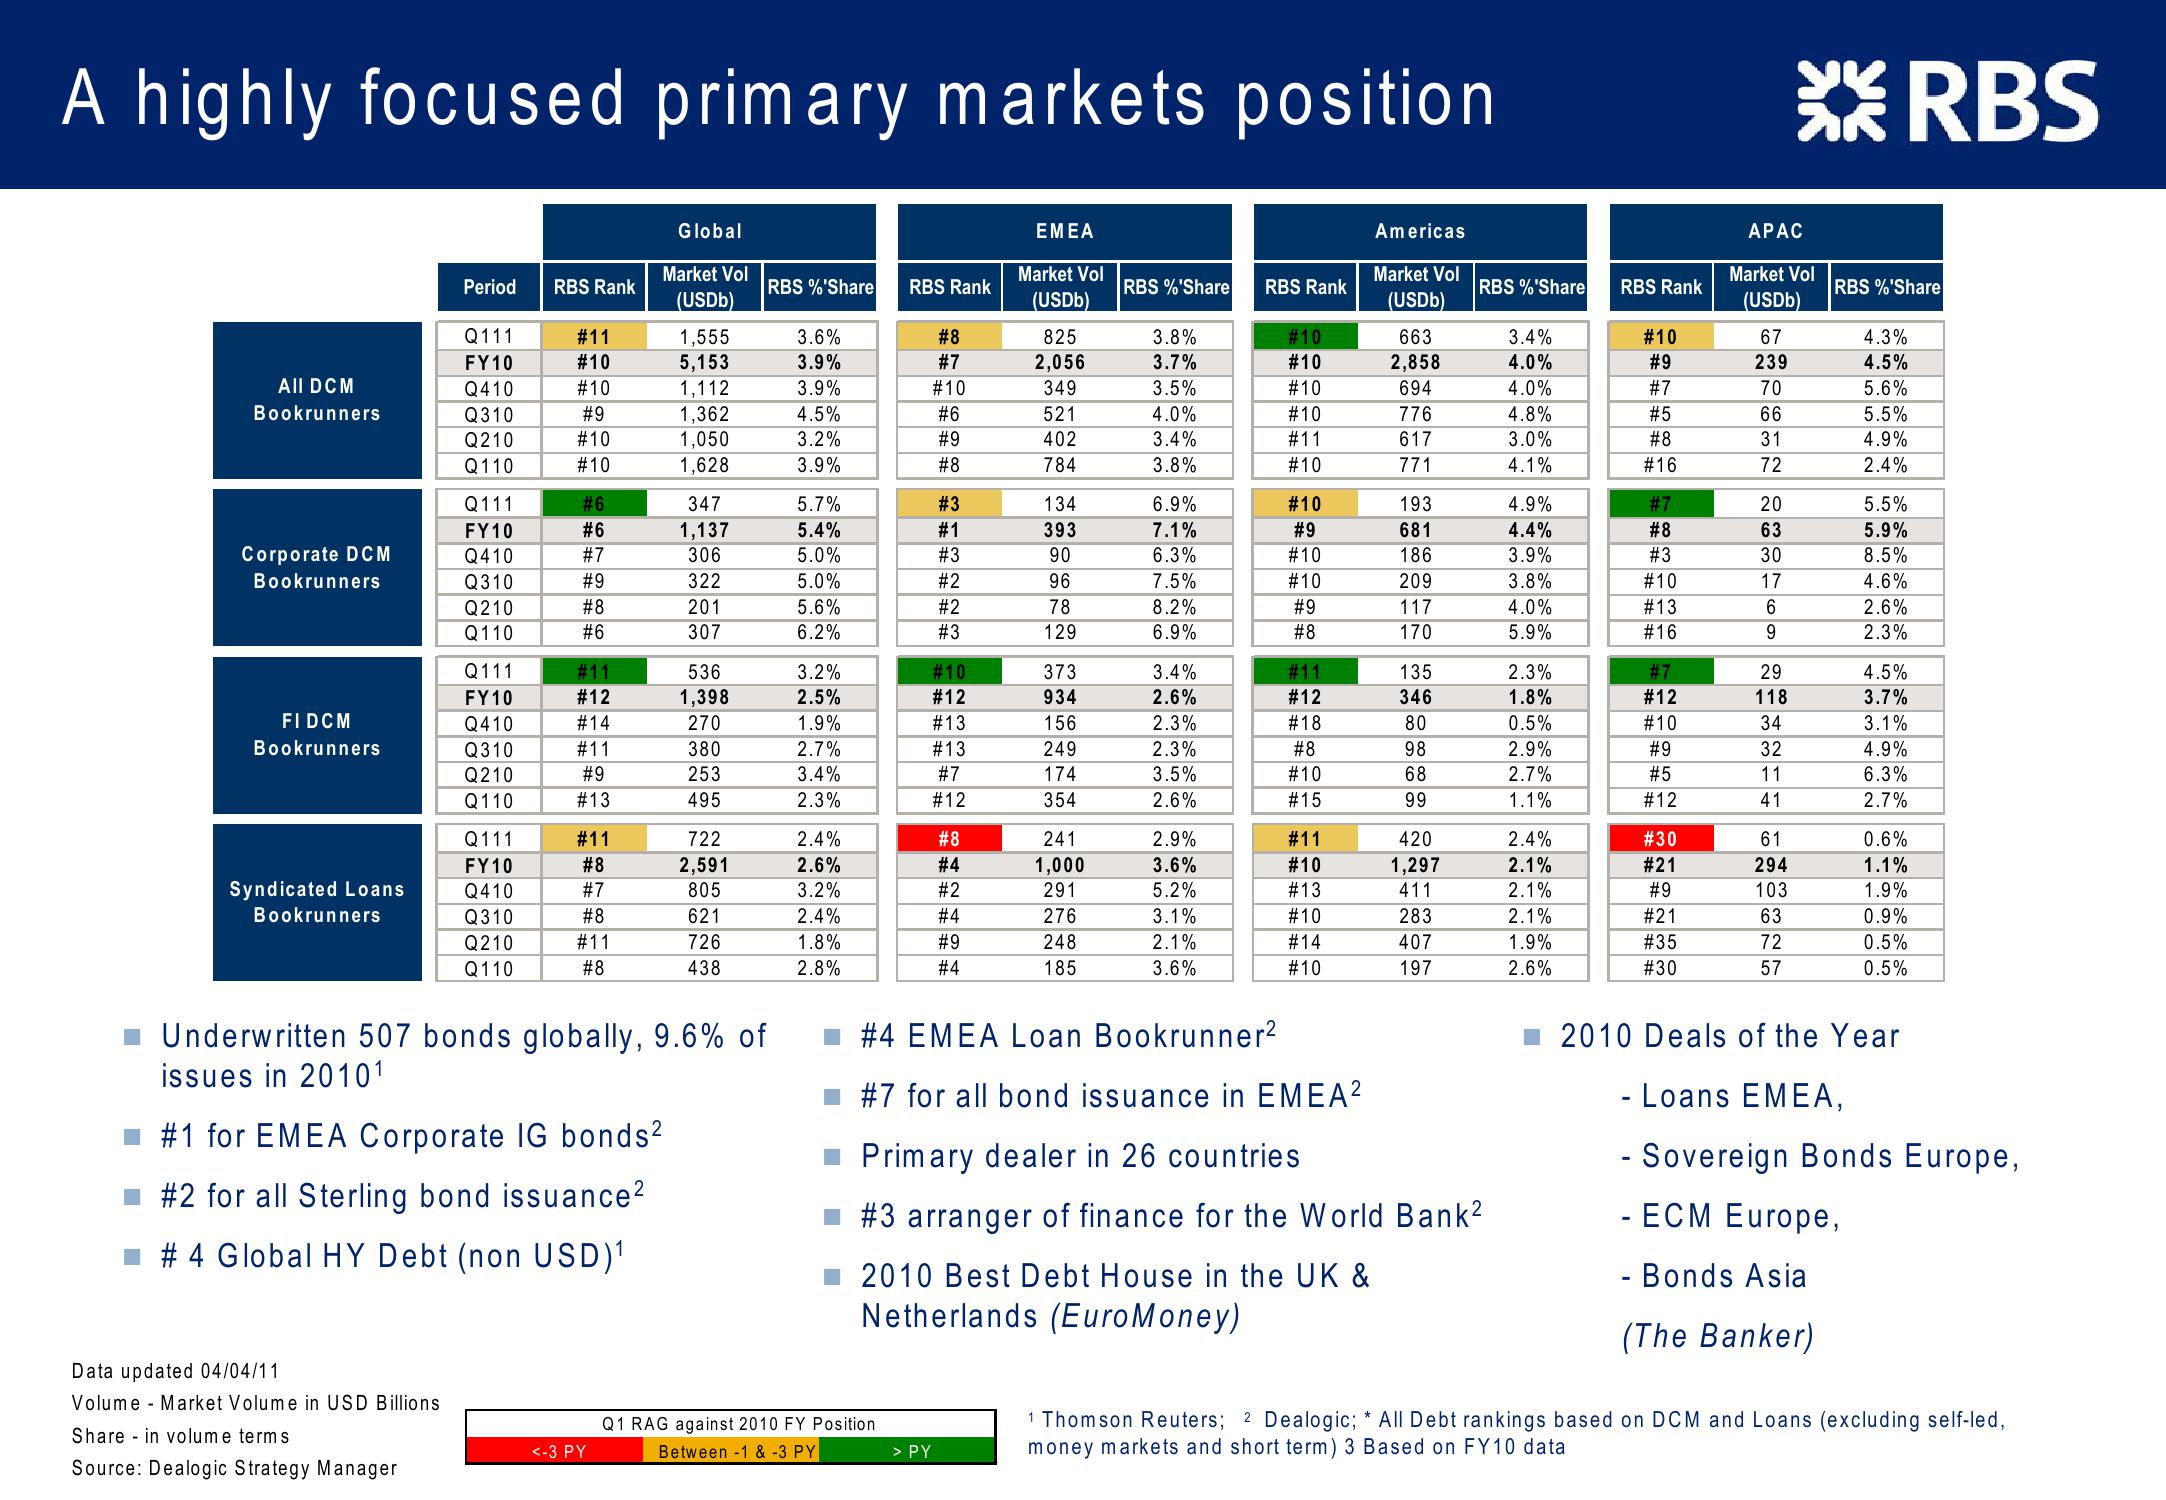
A highly focused primary markets position
RBS
Global
EMEA
Americas
APAC
Market Vol
Market Vol
Market Vol
Market Vol
Period
RBS Rank
RBS %'Share RBS Rank
RBS %'Share RBS Rank
RBS %'Share
RBS Rank
RBS %'Share
(USDb)
(USDb)
(USDb)
(USDb)
Q111
#11
1,555
3.6%
#8
825
3.8%
#10
663
3.4%
#10
67
4.3%
FY10
#10
5,153
3.9%
#7
2,056
3.7%
#10
2,858
4.0%
#9
239
4.5%
All DCM
Q410
#10
1,112
3.9%
#10
349
3.5%
#10
694
4.0%
#7
70
5.6%
Bookrunners
Q310
#9
1,362
4.5%
#6
521
4.0%
#10
776
4.8%
#5
66
5.5%
Q210
#10
1,050
3.2%
#9
402
3.4%
#11
617
3.0%
#8
31
4.9%
Q110
#10
1,628
3.9%
#8
784
3.8%
#10
771
4.1%
#16
72
2.4%
Q111
#6
347
5.7%
#3
134
6.9%
#10
193
4.9%
#7
20
5.5%
FY10
#6
1,137
5.4%
#1
393
7.1%
#9
681
4.4%
#8
63
5.9%
Corporate DCM
Q410
#7
306
5.0%
#3
90
6.3%
#10
186
3.9%
#3
30
8.5%
Bookrunners
Q310
#9
322
5.0%
#2
96
7.5%
#10
209
3.8%
#10
17
4.6%
Q210
#8
201
5.6%
#2
78
8.2%
#9
117
4.0%
#13
6
2.6%
Q110
#6
307
6.2%
#3
129
6.9%
#8
170
5.9%
#16
9
2.3%
Q111
#11
536
3.2%
#10
373
3.4%
#11
135
2.3%
#7
29
4.5%
FY10
#12
1,398
2.5%
#12
934
2.6%
#12
346
1.8%
#12
118
3.7%
FI DCM
Q410
#14
270
1.9%
#13
156
2.3%
#18
80
0.5%
#10
34
3.1%
Bookrunners
Q310
#11
380
2.7%
#13
249
2.3%
#8
98
2.9%
#9
32
4.9%
Q210
#9
253
3.4%
#7
174
3.5%
#10
68
2.7%
#5
11
6.3%
Q110
#13
495
2.3%
#12
354
2.6%
#15
99
1.1%
#12
41
2.7%
Q111
#11
722
2.4%
#8
241
2.9%
#11
420
2.4%
#30
61
0.6%
FY10
#8
2,591
2.6%
#4
1,000
3.6%
#10
1,297
2.1%
#21
294
1.1%
Syndicated Loans
Q410
#7
805
3.2%
#2
291
5.2%
#13
411
2.1%
#9
103
1.9%
Bookrunners
Q310
#8
621
2.4%
#4
276
3.1%
#10
283
2.1%
#21
63
0.9%
Q210
#11
726
1.8%
#9
248
2.1%
#14
407
1.9%
#35
72
0.5%
Q110
#8
438
2.8%
#4
185
3.6%
#10
197
2.6%
#30
57
0.5%
Underwritten 507 bonds globally, 9.6% of
issues in 20101
#1 for EMEA Corporate IG bonds²
#2 for all Sterling bond issuance²
# 4 Global HY Debt (non USD)1
Data updated 04/04/11
Volume
Share in volume terms
■ #4 EMEA Loan Bookrunner²
#7 for all bond issuance in EMEA²
Primary dealer in 26 countries
#3 arranger of finance for the World Bank2
2010 Best Debt House in the UK &
Netherlands (EuroMoney)
Market Volume in USD Billions
<-3 PY
Q1 RAG against 2010 FY Position
Between -1 & -3 PY
> PY
Source: Dealogic Strategy Manager
2010 Deals of the Year
- Loans EMEA,
- Sovereign Bonds Europe,
- ECM Europe,
- Bonds Asia
(The Banker)
1 Thomson Reuters; 2 Dealogic; * All Debt rankings based on DCM and Loans (excluding self-led,
money markets and short term) 3 Based on FY10 datalView entire presentation