Tudor, Pickering, Holt & Co Investment Banking
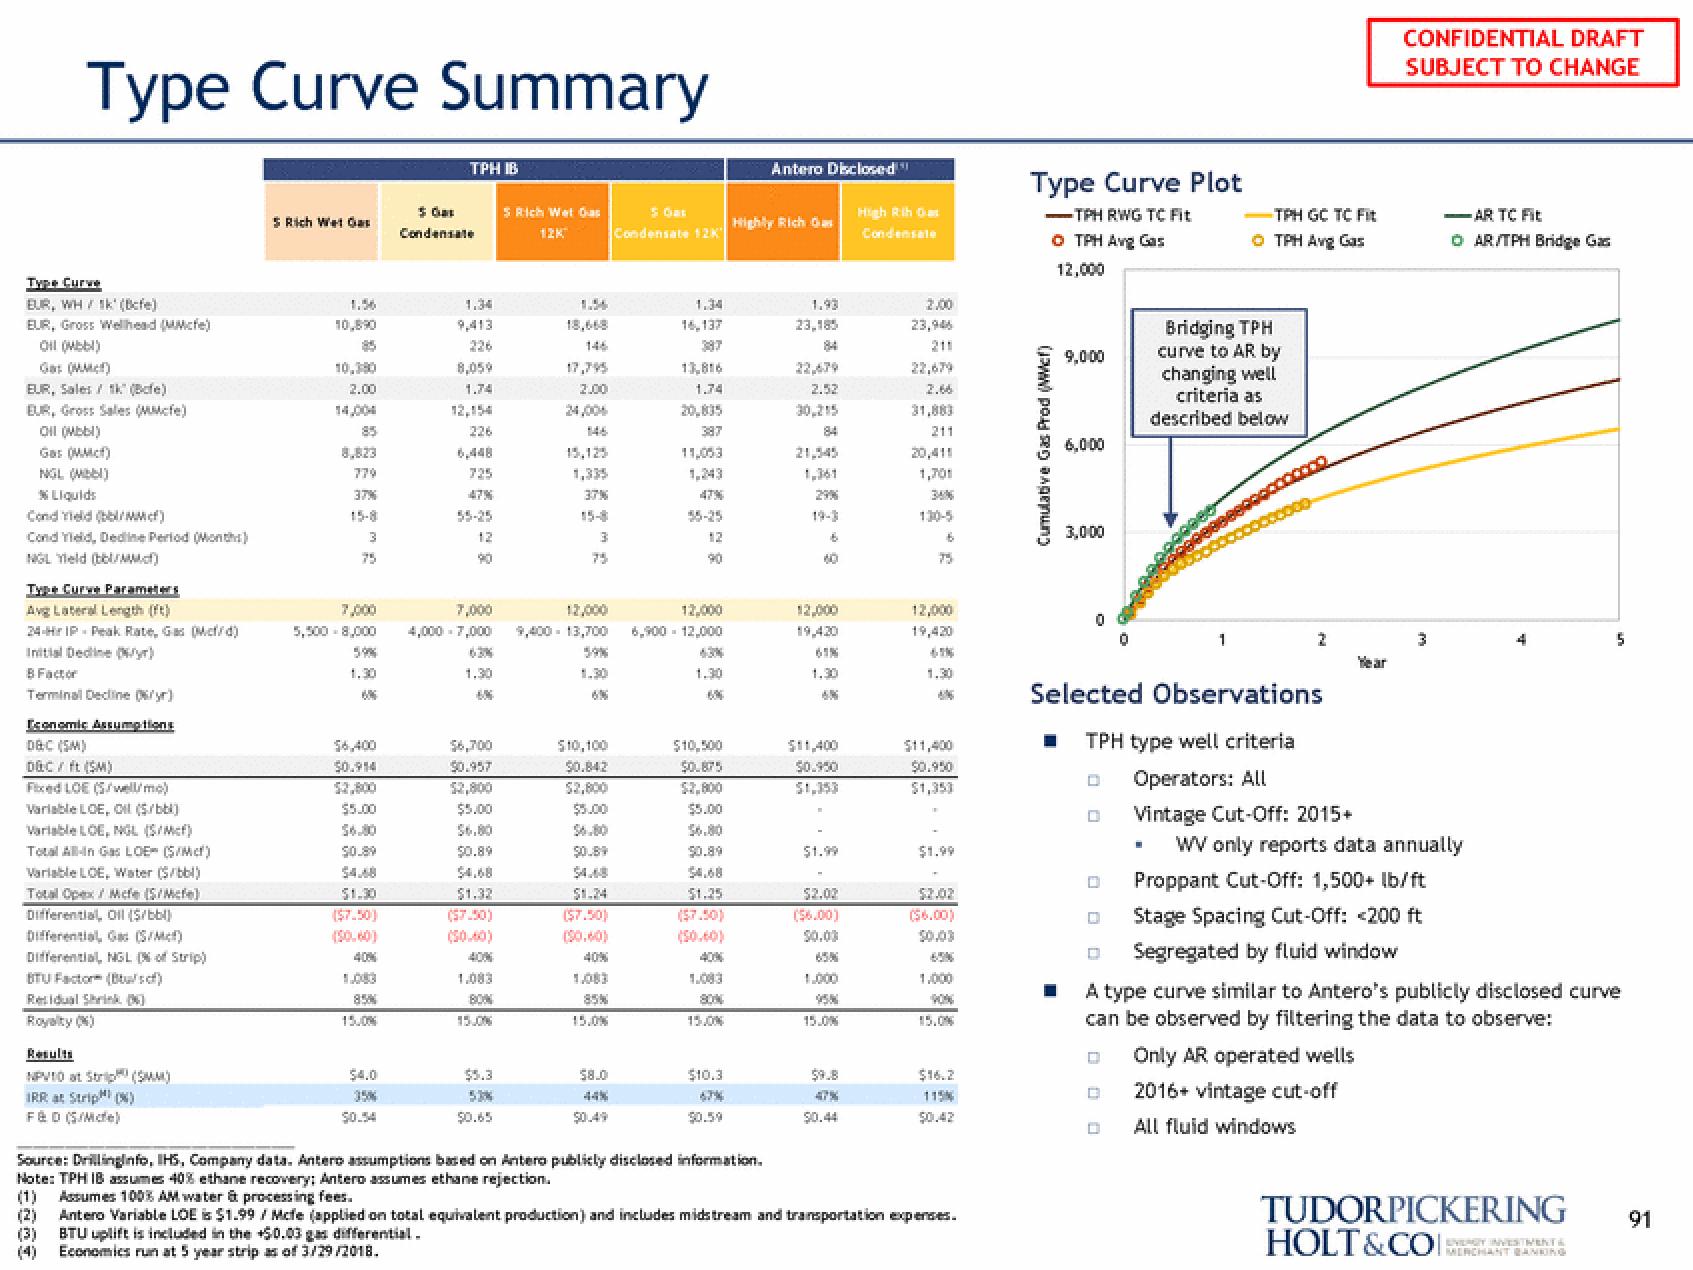
Type Curve Summary
Type Curve
BUR, WH/1k' (Befe)
EUR, Gross Wellhead (MMcfe)
Oil (Mbbl)
Gas (MM)
EUR, Sales / 1k" (Befe)
EUR, Gross Sales (MMcfe)
Oil (Mbbl)
NGL (MBB)
% Liquids
Cond Yield (bb/MMC)
Cond Yield, Dedine Period (Months)
NGL Yield (bb/MM.)
Type Curve Parameters
Avg Lateral Length (ft)
24-Hr IP Peak Rate, Gas (Met/d)
Initial Dedine Oy)
B Factor
Terminal Decline (y)
Economic Assumptions
D&C (SM)
DGC / ft (SM)
Fixed LOE (S/well/mo)
Variable LOE, Oil ($/bb)
Variable LOE, NGL (S/M)
Total All-In Gas LOE (S/M)
Variable LOE, Water ($/bbl)
Total Opex / Mefe (S/Mete)
Differential Oil ($/bbl)
Differential God (S/M)
Differential, NGL (% of Strip)
BTU Factor (Btusef)
Residual Shrink (5)
Royalty (4)
NPV10 at Strip (SMM)
IRR at Strip (%)
F&D (S/Mcle)
5 Rich Wet Gas
1.56
10,890
10,390
2.00
85
8.823
779
37%
15-8
3
75
5,500 - 8,000
59%
$2,800
$6.00
($7.50)
(50.60)
85%
$4.0
$0.54
TPH IB
5 Ga
Condensate
1.34
9,413
8,059
1.74
226
47%
55-25
12
7,000
4,000 -7,000
1.30
$6,700
$0.957
$2,800
$5.00
$6.00
$0.89
$1.32
($7.50)
BOW
$5.3
53%
$0.65
S Rich Wet Gas
12K
146
2.00
37%
3
75
$10,100
$0.842
$1.24
($7.50)
(50.60)
40%
15.0%
Condensate 12K
9,400 - 13,700 6,900 - 12,000
$8.0
44%
1.34
14,137
387
13,816
1.74
387
11,053
12
90
1.30
600
$10,500
$0.875
$2,800
$5.00
$6.80
80%
$10.3
$50.59
Antero Disclosed"
Highly Rich Gas
1.93
23,185
84
2.52
84
21,545
29%
6
40
AN
$0.950
($6.00)
50.03
95%
15.0%
47%
$0.44
High Rih Gat
Condensate
2.00
211
20,411
1,701
130-5
6
75
$11,400
$1,353
$1.99
($6.00)
$16.2
115%
$0.42
Source: Drillinginfo, IHS, Company data. Antero assumptions based on Antero publicly disclosed information.
Note: TPH IB assumes 40% ethane recovery: Antero assumes ethane rejection.
(1) Assumes 100% AM water & processing fees.
(2) Antero Variable LOE is $1.99 / Mcfe (applied on total equivalent production) and includes midstream and transportation expenses.
(3) BTU uplift is included in the +$0.03 gas differential.
(4) Economics run at 5 year strip as of 3/29/2018.
Type Curve Plot
-TPH RWG TC Fit
Ⓒ TPH Avg Gas
12,000
Cumulative Gas Prod (MMC)
9,000
6,0:00
3,000
M
☐
.
-TPH GC TC Fit
ⒸTPH Avg Gas
Bridging TPH
curve to AR by
changing well
criteria as
described below
1
Selected Observations
TPH type well criteria
Operators: All
Vintage Cut-Off: 2015+
2
CONFIDENTIAL DRAFT
SUBJECT TO CHANGE
3
-AR TC Fit
ⒸAR/TPH Bridge Gas
WV only reports data annually
Proppant Cut-Off: 1,500+ lb/ft
Stage Spacing Cut-Off: <200 ft
Segregated by fluid window
4
5
A type curve similar to Antero's publicly disclosed curve
can be observed by filtering the data to observe:
Only AR operated wells
B 2016+ vintage cut-off
All fluid windows
TUDORPICKERING
HOLT&COCHANT BANKING
91View entire presentation